
As a bettor are you aware that you can use standard deviation to predict betting outcomes? Find out what the standard deviation is, how to calculate it and apply it to your betting.
In a previous article, we explained why bettors should not solely rely on the average, given its tendency to be influenced by outliers, and its inability to show the dispersion within a set of numbers.
Dispersion can be measured in many ways, one of which is the standard deviation - a quantity expressing by how much the value of a group differ from the mean value for the group. Different metrics are either used directly or are input parameters for a function or distribution.
Poisson vs. Normal Distribution
For example, bettors are known to use a Poisson distribution model to predict the number of goals scored per team in a soccer game. However, this distribution has just one input parameter - the average - and is a discrete distribution - produces outputs as whole numbers.
A Poisson distribution model can estimate directly the likelihood of scoring one goal, rather than the probability of a goal occurring between the 25th and 30th minute (although it can be extended to derive these).
Normal distribution - the bell or Gaussian distribution – is also popular. This is a different model to Poisson for a number of reasons but also because it’s a continuous distribution, based on two parameters: the average andstandard deviation.
Predicting goals spread in the Premier League
As a test case let’s look at game goal difference in soccer. The goal difference per match seems to be normally distributed. The goal difference is the number of goals scored by the home team minus the goals scored by the away team, with a zero resulting in a draw.
Lets look at the data from the 2013/14 Premier League season:
- Man City recorded the biggest home win - 7-0 against Norwich
- Liverpool’s 5-0 win at Tottenham was the biggest away victory
- The average goal difference was 0.3789 (median & mode = 0)
- The standard deviation was 1.9188.
A number of conclusions can be taken from the data. Primarily the most popular goal difference is a draw, and the distribution is close to symmetric, with a favour towards home wins. However, our focus for the article is the standard deviation.
Calculating the Standard Deviation
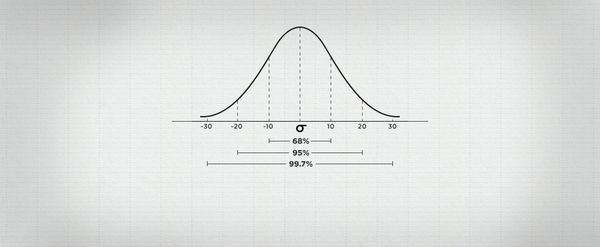
The normal distribution uses the two parameters (average and standard deviation) to create a standardised curve. In this, around 68% of the distribution lies within one standard deviation away from the mean, and 95% lies within 2 standard deviations.
In this case we expect 68% of games to end up between -1.5399 and 2.2977 goals (i.e. 0.3789 + 1.9188). The continuous nature of the curve does have its limitations: -1.5399 goal difference is not possible.
In order to estimate a home win by a goal difference of 1, 1 can be moved from a discrete (whole) value of 1, to represent the continuous range between 0.5 and 1.5. For each value we can then calculate its difference from the mean in terms of standard deviations.
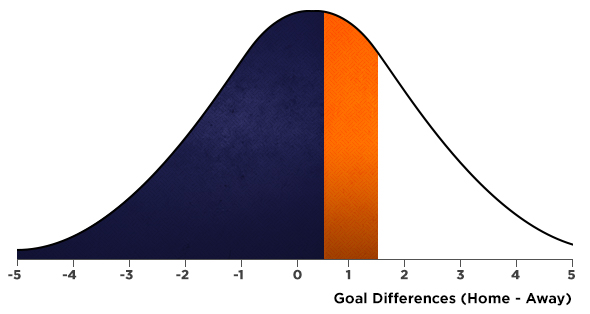
The great thing about this is that we can now remodel the normal distribution as shown. In this case we’d need to find the area of the region shaded in orange.
The area shaded in blue, showing the probability of less than 1 goal (or its continuous equivalent being less than 0.5 goals) can be found to be 52.15%.
While it is not the aim to delve deep into the calculation of this, it can be found using most spreadsheet software (in MS Excel: =NORM.DIST(0.5,0.3789, 1.9188,1). Similarly the probability of under 1.5 goals is 72.05%. Therefore we expect 19.53% between these two values.
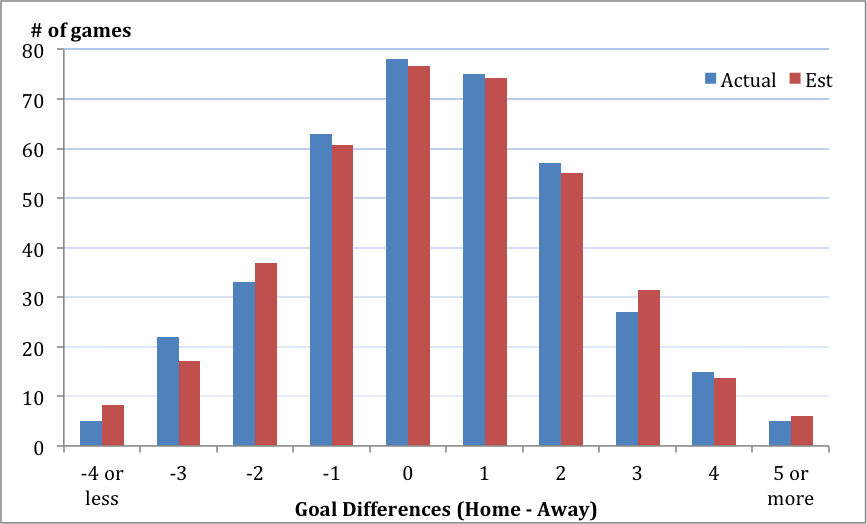
Consequently out of 380 matches, we would have estimated 74.22 games ending with the home team winning with just one goal difference. In reality there were 75 games, so this was very close.
By repeating this for all goal differences, we can compare the actual and estimated number of games that ended up with different goal differences.
The table below shows that the discrepancy is minimal and the normal distribution appears to be a good fit - (there are ways to test for normality and this distribution fits nicely for 2013/14 EPL data).
Let’s now assume the distribution is correct for the current Premier League season. So as a spread bettor you may want to know what the probability of a home team winning by one or more goals is in the Premier League? This is therefore equivalent to the 1 - 52.52%, which is 47.48%.
Obviously this is a general estimate and applies to the Premier league in general rather than individual teams –bettors would be advised to work out individual teams data rather than that of the EPL in general.
In conclusion, the standard deviation is not just a measure of spread, whereby a higher value displays more dispersion within a group; it’s also an important parameter to measure probabilities, something very helpful for sports bettors. In a future article we will focus on how a different standard deviation can affect probabilities and spreads.
Dominic Cortis is a lecturer with the Department of Mathematics at The University of Leicester; and an assistant lecturer at The University of Malta. He is an associate actuary and his research focuses on sports analytics as well as financial and betting derivatives.
MORE: TOP 100 Online Bookmakers >>>
MORE: TOP 20 Bookmakers that accept U.S. players >>>
MORE: TOP 20 Bookmakers that accept Cryptocurrency >>>
Source: pinnacle.com