
This article explains to soccer bettors how to use standard deviation for handicap betting. By understanding this, you can gauge the probability of a team covering the spread more accurately, which can translate to more profit.
These previous articles explained why bettors shouldn’t rely solely on the average and how the standard deviation can be used to calculate probabilities.
However how can bettors use this information to aid their betting? Here we take things further by using the standard deviation to predict better handicap results.
Using Europe’s top soccer leagues as a testcase
Below we use data from the 2013/14 season for the top divisions in England, France, Germany, Greece, Italy, Portugal, Spain and Turkey.
The table highlights the goal differences - between home and away goals scored - during last season. A positive goal difference indicates that the home team won, while a negative goal difference represents an away team win.
| England | France | Germany | Greece | Italy | Portugal | Spain | Turkey | |
|---|---|---|---|---|---|---|---|---|
| Minimum | -5 | -5 | -5 | -5 | -7 | -5 | -5 | -5 |
| Maximum | 7 | 5 | 6 | 7 | 5 | 4 | 7 | 6 |
| Median | 0 | 0 | 0 | 1 | 0 | 0 | 0 | 0 |
| Mode | 0 | 0 | 0 | 1 | 0 | 0 | 0 | 0 |
| Average | 0.3789 | 0.3763 | 0.3743 | 0.5948 | 0.35 | 0.2875 | 0.5132 | 0.4197 |
| Standard Deviation | 1.9188 | 1.5975 | 1.7757 | 1.7591 | 1.7071 | 1.6379 | 1.9526 | 1.7151 |
The table highlights some similarities:
- Biggest home win was typically between 5 and 7 goals
- Biggest away win was typically 5 goals
- Most likely goal difference is a draw
- Home teams tend to score more than away teams
However as bettors would expect there are some variances between leagues. The Greek Superleague has a higher goal difference average, while the most frequent goal difference sees the home team winning by one goal.
In comparison the Portuguese Primeira Liga has the lowest average goal difference, while France’s Ligue 1 and Spain’s La Liga are at differing extremes of the standard deviation.
The graph below shows how the distribution of goal differences, if modelled using a normal distribution (readthis article), can be helpful in understanding these subtle differences.
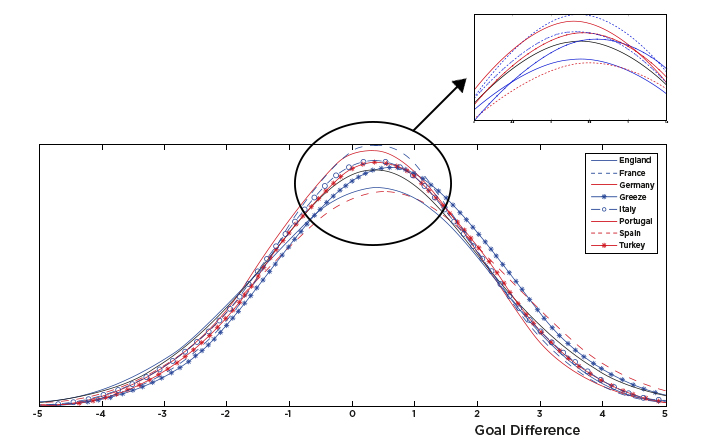
By looking at the graphs bettors should note:
- The lower the standard deviation (France & Portugal) the narrower the curve.
- The mid-point of the graph is higher for the Greek Superleague than any other league.
So how does this affect handicaps?
Now we have the data we can relate it to the soccer handicap market. For example by inputting the data above in the form below you can calculate the probability of a team winning by a number of goals, something very helpful for handicap bettors.
| Probability | England | France | Germany | Greece | Italy | Portugal | Spain | Turkey |
|---|---|---|---|---|---|---|---|---|
| Home Team winning | 47.50% | 46.90% | 47.20% | 52.10% | 46.50% | 44.80% | 50.30% | 48.10% |
| Home Team winning by more than 2.5 goals | 13.40% | 9.20% | 11.60% | 13.90% | 10.40% | 8.80% | 15.40% | 11.30% |
The probabilities shown in the table above highlight the chance of a home win and the home team winning by more than 2.5 goals across the leagues mentioned earlier.
From the data we can see that on average home teams in France score more than in Germany (0.3763 vs 0.3743), however they are less likely to win and less likely to win by a large margin. Why is this?
It’s due to a lower standard deviation (1.5975 vs 1.7757), which means goal differences in France are less likely to be at the extreme end of the scale.
The Greek and Spanish are the only leagues in which a home team is more likely to win than draw or lose – it’s not that surprising given they have the largest average goal difference.
Despite home Greek teams being more likely to win, Spanish teams are more prone to win by a bigger margin. The reason? The higher standard deviation in Spain shows that there is a higher likelihood of extreme goal differences in La Liga. Bettors can start to see a pattern forming here.
Similarly in England home teams win less often than in Turkey, but a higher spread of goals means bettors may find more value betting on the home team to cover the handicap than in Turkey.
Bettors should note that the higher standard deviation in some leagues can lead to a higher proportion of large wins and losses, something valuable to handicap bettors.
The use of the normal distribution has been discussed from a different perspective in this article and explains how to use Standard Deviation for handicap betting. The assumptions set in other articles still apply though: chiefly the distribution must be a bell shaped curved and not skewed to any side. In future we will discuss how to test this assumption in greater detail.
Dominic Cortis is a lecturer with the Department of Mathematics at The University of Leicester; and an assistant lecturer at The University of Malta. He is an associate actuary and his research focuses on sports analytics as well as financial and betting derivatives.
MORE: TOP 100 Online Bookmakers >>>
MORE: TOP 20 Bookmakers that accept U.S. players >>>
MORE: TOP 20 Bookmakers that accept Cryptocurrency >>>
Source: pinnacle.com