
At any stage during a match, either one side is ahead or we have equality with a variable number of changes in the lead. Ever wondered how often the lead changes? Hint: Don’t put your money on what your intuition is telling you. Read on to find out why!
From carrying an umbrella to placing a bet, we make decisions based on our understanding of probabilities on a daily basis. Yet, our natural instincts often manage to misguide us, with statistics being our most trusted ally to get us back on the paths of righteousness.
Warning: The mental pitfall revealed in this article is so counterintuitive that it has astonished even the most sophisticated statisticians. But before we proceed to the theory, let’s put our natural instincts to the test.
Two equally skilled snooker players play against each other. How many times do you think the lead changes? Do you expect more or less changes of lead the more frames they play?
Since we assume equal skill, we can use the most famous randomizing device - i.e. the coin flip - to observe how the lead changes, by allocating heads to one player and tails to the other. In order for a lead change to occur, the player who is behind needs to catch up first. So, let’s starts with how often equalization is the case.
If we flip a coin six times, we intuitively understand that getting six consecutive heads is not a very likely outcome. Six flips can generate 64 possible combinations. The probability of getting all six tosses alike- either all heads or all tails - is 2/64, or approximately 3%. (1 x ½ x ½ x ½ x ½ x ½)
We also understand that despite each outcome having 50% chances, this does not necessarily mean that in a sample as small as six coin tosses we will necessarily get three heads and three tails.
The actual probability of equal numbers of heads and tails in six coin tosses is 20/64 (ca. 31%) or about one out of three. Does this means that if we repeat our coin flipping experiment of six consecutive coin tosses three times, we are guaranteed one outcome of equal numbers of heads and tails? Again, not necessarily.
Calculating the probabilities of equalization
So, for different numbers of coin tosses, what are the chances of getting equal numbers of heads (H) and tails (T)? At any stage either H leads or T leads or we have equality. To have equality in any sequence, the total number of tosses must be even.
As we increase the number of tosses (2,4,6,8…), we are likely to think that equal numbers of H or T become more likely. This is an intuitive application of the law of averages; the common belief that as sample size grows, outcome gets closer and closer to the average of the whole population or, more simply, the reason why we are likely to expect a sunny day following a week of rainy days.
From a statistics point of view, though, this is not just wrong; it is spectacularly wrong.
In “Taking Chances” John Haigh examines the probabilities of equal numbers of H and T at any point in a sequence of independent tosses.
| Probabilities of equal number of heds (H) and tails (T) | |||||
| Number of tosses | 2 | 4 | 6 | 8 | 10 |
| Chance of equality | 1/2 | 3/8 | 5/16 | 35/128 | 63/256 |
| Probability | 50% | 37.5% | 31.25% | 27.34% | 24.6% |
The pattern that emerges from the numbers is so counterintuitive, that even the most mathematically inclined amongst us have to look at the data twice to believe. The data shows that as the number of tosses increases the probability of equalization actually decreases.
If we carry on tossing the coin 20 times, where in the history should we be expecting to find the last time H and T were level? It can be at any one of 2,4,6…, 16, 18 or 20 tosses. With 11 possible answers, where would you put your money on? A recent toss, a distant toss or a middle one?
Many people feel inclined to answer somewhere in the middle, however American Professor of Statistics, David Blackwell, found that there is total symmetry about the middle. The chance that the time H and T were last equal at 16 tosses was the same as at 4 tosses, with 0 and 20 having the highest individual chances and the probabilities decreasing as we move towards the middle.
| Chances of last equality at different times in a sequence of 20 coin tosses | ||||||
| Time of last equality | 0 or 20 | 2 or 18 | 4 or 16 | 6 or 14 | 8 or 12 | 10 |
| Probability | 17.62% | 9.27% | 7.36% | 6.55% | 6.17% | 6.06% |
In other words, if equalization doesn’t come early on, it might take a very long time to happen.
How often does the lead change?
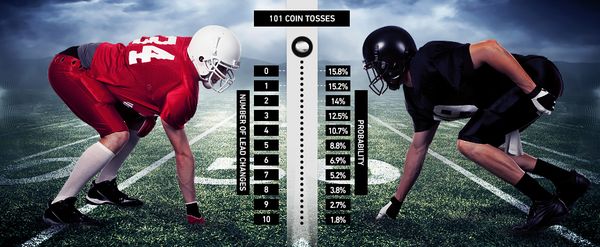
What does the above mean for the frequency by which the lead changes? Below is a table with the probabilities of the numbers of times the lead changes hands between H and T in a sequence of 101 tosses.
| Number of lead changes | Probability |
| 0 | 15.8% |
| 1 | 15.2% |
| 2 | 14% |
| 3 | 12.5% |
| 4 | 10.7% |
| 5 | 8.8% |
| 6 | 6.9% |
| 7 | 5.2% |
| 8 | 3.8% |
| 9 | 2.7% |
| 10 | 1.8% |
| 11 | 2.6% |
68% of the time the lead change will not exceed four times. Five to nine changes occur about 27% of the time and ten or more a mere 4%-5%.
To make things more interesting, half of the time the score never equalized in the second half of the sequence, meaning, that whichever of H or T was ahead at the halfway point stayed ahead over the entire half of the experiment.
Applying the coin toss wisdom in sports betting
Hopefully, at this point the application to betting has become clear. What the coin experiment teaches us is that among equally skilled players, there are typically lengthy periods with no equalization and then perhaps several equalities near together. The equalizations are much more likely to have been right at the beginning or right at the end of a match, rather than near the middle.
Haigh calculated that in 50% of snooker matches between players of equal skill, the player ahead after 16 frames remains ahead all the time until after the frame 32. Can we go as far as to apply the same logic in soccer? Despite Leicester City being on track to confirm the theory, several teams of different skill level comprise a league; it, therefore, requires further investigation before we can safely assume that the rule applies.
Not every outcome is as clear cut as a coin flip of course, as there is a number of situational factors that are to be considered, such as loss aversion for example - the tendency to perform better in situations where we are trying to avoid defeat, rather than if we were just aiming to win. The coin flip experiment is a theoretical, but nevertheless very relevant pattern for sports bettors.
MORE: TOP 100 Online Bookmakers >>>
MORE: TOP 20 Bookmakers that accept U.S. players >>>
MORE: TOP 20 Bookmakers that accept Cryptocurrency >>>
Source: pinnacle.com