
There is a common belief in momentum, or hot handedness, in sport despite studies claiming to disprove the concept. Should bettors discard the concept of form? This article argues that it may be an error to do so.
In 1985, the same year that Michael Jordan won the NBA’s rookie of the year, a paper published in the Journal of Cognitive Psychology purported to debunk the commonly held perception that basketball players display periods where their shooting performance elevates to be better than what would be expected by chance.
Specifically, the paper’s authors (Gilovich, Vallone and Tversky - ‘GVT’) concluded that the widely held belief in basketball players exhibiting periods of momentum in their shooting was a ‘cognitive illusion’. This phenomenon became known as the ‘Hot Hand Fallacy’, and draws parallels to the more general, ‘Gambler’s Fallacy’. The apparent bias has been explained as a human desire to seek out patterns and make sense from randomness.
Belief in streakiness, or hot handedness, in sport is certainly not limited to basketball. Terms such as ‘in form’, ‘on fire’, ‘in the zone’ and ‘purple patch’ have endured as commonplace in commentary vernacular and analysis across many sports.
This is despite the finding of the GVT, and numerous subsequent papers exploring the hot hand fallacy. To this day, you may struggle to watch sport without a commentator referring to such terms implying some momentum in performance, or a divergence from randomness.
Why then have sports fans and commentators perpetuated this notion of momentum in sports for over 30 years? New research shows that our intuition regarding the presence of momentum is likely to have been correct all along.
In a paper entitled, ‘Surprised by the Gambler’s and Hot Hand Fallacies? A Truth in the Law of Small Numbers’, Miller and Sanjurjo show that the basketballers in the GVT study did actually exhibit a hot hand, and as such the hot hand fallacy is in itself a fallacy. The reason for the erroneous results in the 1985 GVT study is due to a simple but important sampling error. It is best explained using an example.
Consider flipping a fair coin five times. You undertake to observe and record the result of each flip immediately following two successive heads. After five flips, what is the expected proportion of heads that you have recorded? 50%? Less or more than 50%?
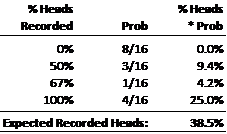
One might assume, as GVT did, that because the coin is fair the probability should be 50%, however it is less. When flipping a fair coin five times, there are 32 possible, equally likely sequential outcomes. These are shown in column 2 below.

In 16 of the 32 possible sequences, there is at least two heads in a row prior to flip 5, thus requiring a ‘record’ to be made. 8 of these have 0% heads, 3 have 50% heads, 1 has 67% heads and 4 have 100% heads. Given each of these 16 sequences is equally likely, the expected probability of recording a head following 2 successive heads is just 38.5%.
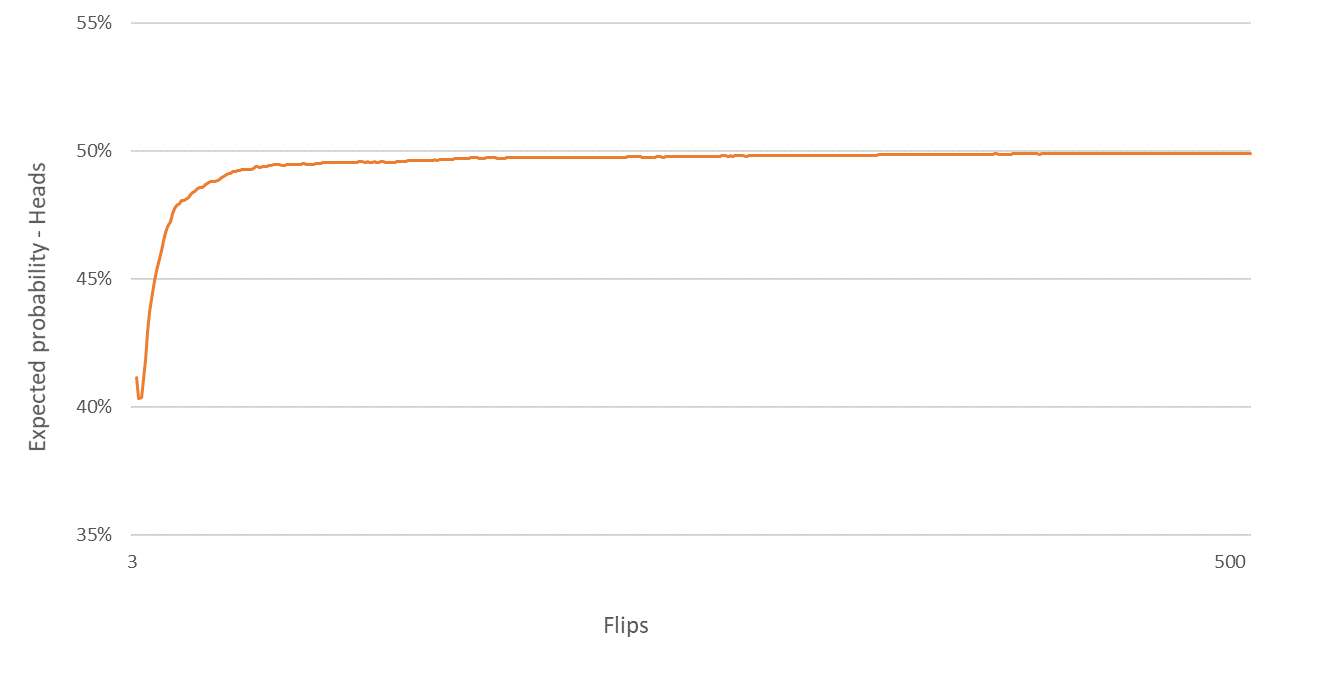
This result seems counterintuitive, and has led to errors in ‘hot hand’ studies subsequent to and including the GVT paper. In order to understand the bias visually, consider the simple scenario where we want to know the chance of flipping a head following just one head. The chart below plots this expectation up to 500 flips of a fair coin, derived using 5,000 simulations.
Quantifying the sampling bias
The bias can be quantified as the vertical distance between the orange line and the true unconditional expectation, 50%. If the coin is flipped just 10 times, the chance of recording a head following a head is 44.5%. As such, the bias is 5.5 percentage points.
In a sporting context, you’re unlikely to hear reference to a hot hand after making just one shot, or winning one point. The chart below plots the bias for the chance of a success following a run of ‘k’ consecutive successes, given a true probability of 50%. Again, I used 5,000 simulations.
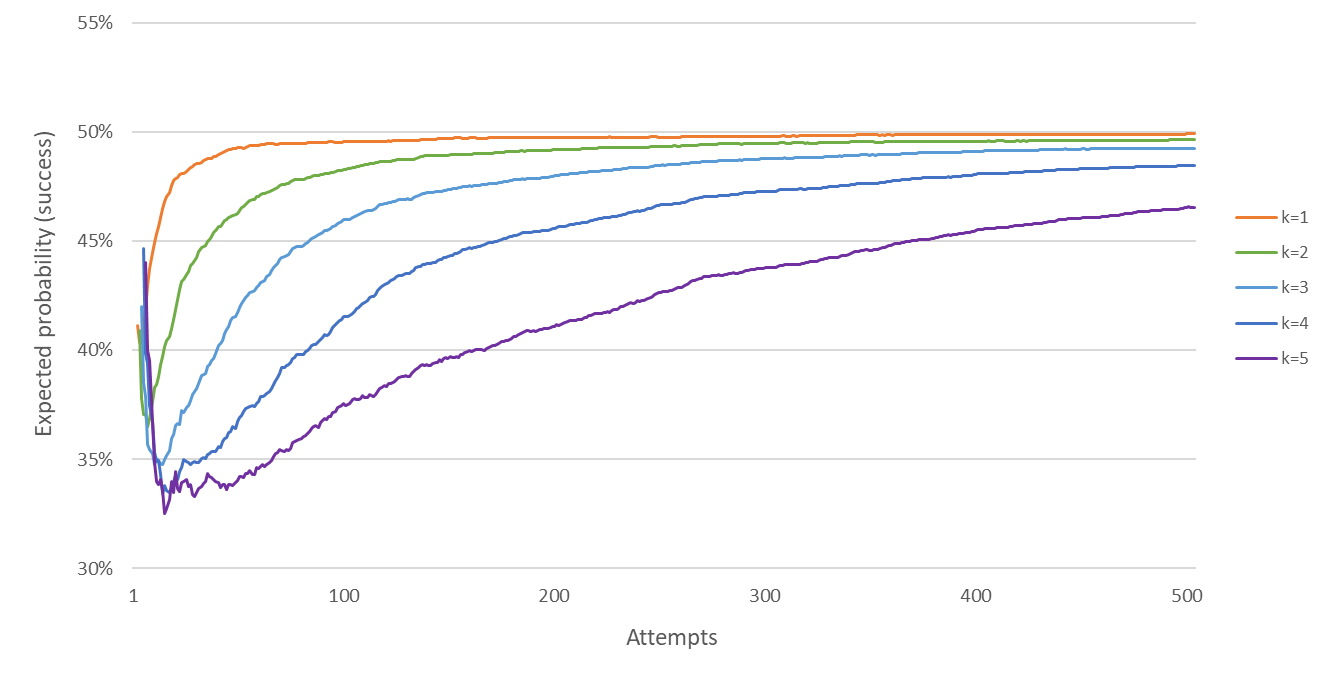
We can see that the bias increases with the length of consecutive successes, and decreases with the number of attempts. In their study, GVT devised a controlled basketball shooting experiment where 25 college players took 100 shots each and shooting percentages were recorded following a run of ‘k’ makes or misses (k = 1,2,3).
The shooting location for each player was determined by estimating a 50% success rate. GVT directly compared shooting percentages following a streak of makes to that following an equivalent streak of misses. Their hypothesis was that the probability of a make following k makes was equalto the probability of a make following k misses.
However, we know from above that these percentages are not expected to be the same. Assuming a player’s true probability of making each of the 100 shots was 50%, the probability of a make following a streak of 3 makes is ~ 46%. By symmetry, the probability of a make following a streak of three misses is ~ 54%.
The magnitude of the bias is such that when it is adjusted for, GVT’s conclusions regarding a lack of hot hand shooting can be reversed. The vast majority of the players did actually exhibit hot hand shooting. In a sporting context, the probability of any ‘success’ is unlikely to be constant at 50%. In the NBA for example, the average free throw percentage is about 75%. To understand how the bias varies with the probability of success, the chart below estimates the bias for a success probability of 75%, from 5000 simulations.
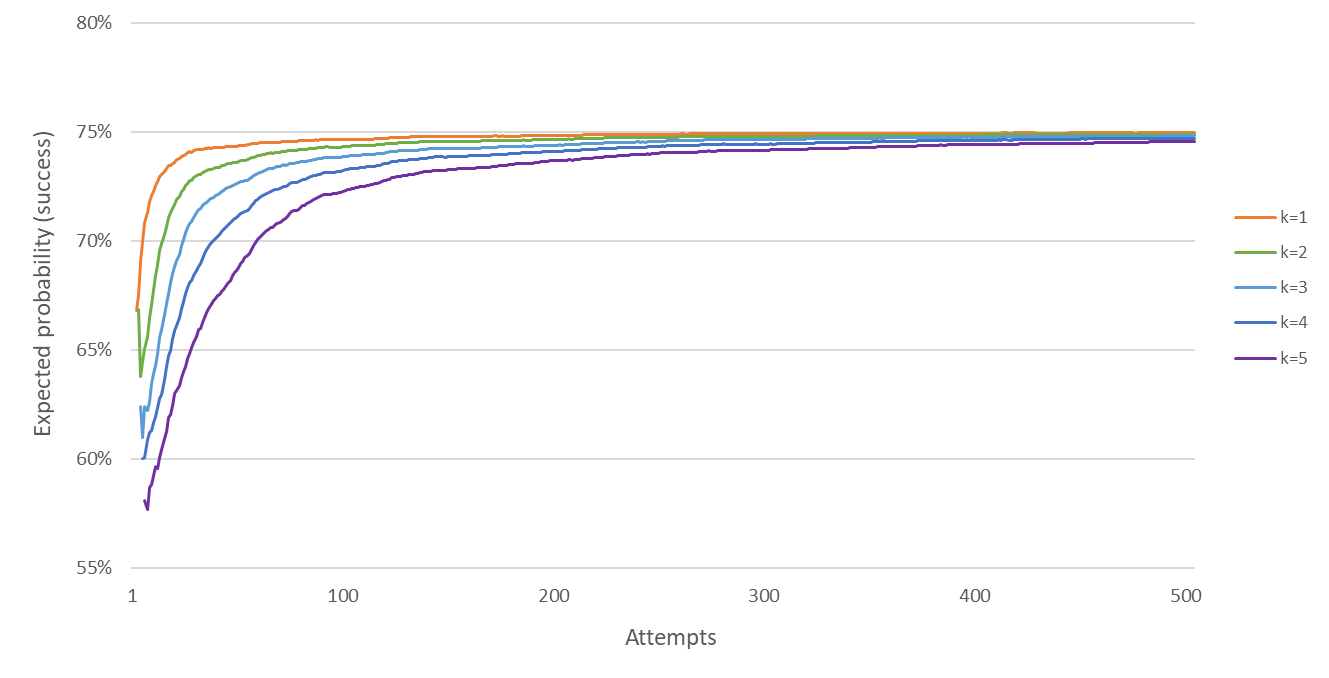
By comparing the two charts we can see that the bias decreases as the success probability increases. For example, with 100 attempts the probability of a success following 5 successes when the unconditional probability is 50% and 75% was 38% and 72%. This equates to a bias of 12% (50% - 38%) and 3% (75% - 72%) respectively.
Hot Hand shooting in the NBA All Star three-point contest
Next, I examine whether participants in the last four (2015 – 2018) NBA All Star 3-point contests exhibit hot hand shooting. The contest lends itself to hot hand analysis as conditions and shot placements are identical and there is no defensive pressure. The format sees players attempt 25 three-point shots per round from 5 set positions around the arc.
Across the four years, 46 players competed, attempting a total of 1150 shots, and making 54%. The table below shows each player’s conditional shooting percentages following one make, one miss, two makes and two misses.
NBA three-point contest statistics
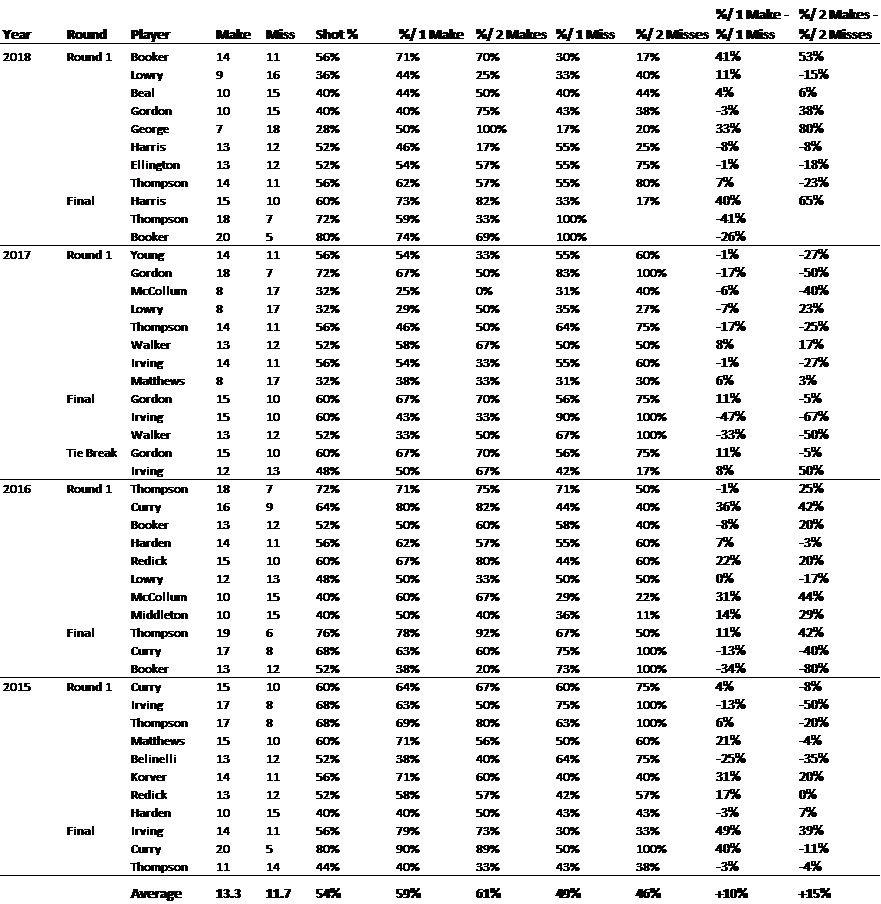
Shooting percentages are higher than average following one or two makes and lower than average following one or two misses.
Column 11 calculates the difference in shooting percentage following either a make or a miss (Shot % following one make minus Shot % following one miss). GVT used this difference as their test of hot hand shooting.
Using the raw numbers as GVT did, we can see that across the four competitions, 24 players were positive and 21 were negative, and on average a player was 10 percentage points better following a make. However, we now know of the sampling bias and must account for it.
If we make the rudimentary assumption that each player’s expectation of a make is 54% (the average), the probability of hitting a shot following a hit is ~52%. By symmetry, the probability of hitting a shot following a miss is ~56%. As such, we can add 4% to column 11 to account for the sampling bias.
Having made the adjustment, we can now interpret the statistic such that a positive percentage means that the player performed better after making a basket than after missing one. Following the adjustment, 32 players were positive and 14 were negative. On average, a player’s shooting percentage was 14 percentage points higher following a make. This suggests strong evidence of hot hand shooting.
If we make the respective adjustments for column 12 (Shot % following two makes minus Shot % following two misses), 30 players exhibit hot hand shooting (are positive), up from 19 if the bias remained unaccounted for. The average increase in shooting percentage following two makes is 29%, again providing strong evidence of hot hand shooting in recent NBA 3-point contests.
Intuition vs Analysis
While the hot hand fallacy has endured for over 30 years, so too has the confidence from sports fans and commentators alike that the hot hand fallacy is itself a fallacy, and momentum in performance does exist. Terms such as ‘streaky’, ‘in sync’ and ‘on fire’ never vacated the sporting vernacular, suggesting that intuition and instinct may be equally as important as statistical analysis when trying to explain sporting performance, given that they both may contain biases.
While momentum in sports may have had a recent positive confirmation in academia, bookmakers have long been aware that it exists. Depending on the sport, team and players, in-play odds pricing models will generally have an element of momentum built in.
In a previous article I showed the effect of momentum between sets in professional tennis matches. If a bettor can more precisely determine which team or player is likely to have over or undershot the implied probability reflected in odds, they may be able to profit, irrespective of whether their predictions stemmed from statistical analysis or instinct.
MORE: TOP 100 Online Bookmakers >>>
MORE: TOP 20 Cryptocurrency Sportsbooks >>>
MORE: Best E-Sports Betting Sites >>>
Source: pinnacle.com