It is a common misconception that betting is all about results. The key to successful betting lies in finding value in the market and consistently beating the closing line. But just how often do you need to beat the closing line before you can expect to make a profit? Read on to find out.

In a previous article that analysed the importance of beating closing odds, we learned how the odds at market closure, on average, provide the most accurate (or efficient) assessment of result probabilities. For example, where Pinnacle’s closing odds are 2.00 the implied result probability will be 50% (discounting the influence of their margin).
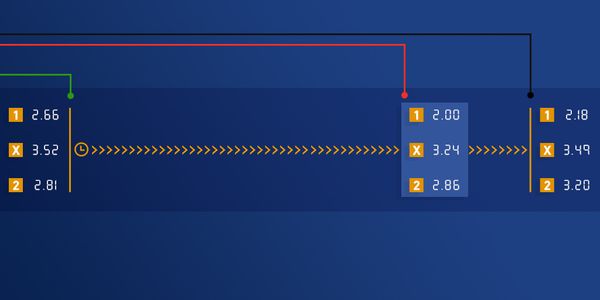
The relationship between the odds a bettor takes and Pinnacle’s closing odds has been shown to provide a very reliable measure of profit expectation. If a bettor were to take odds of 2.20 and Pinnacle’s market closes with odds of 2.00, the profit expectation held will be given by the ratio 2.20/2.00 = 1.1 or 10% (minus Pinnacle’s margin).
The importance of odds movement
Given the inherent random variability in sports forecasting markets, no bettor is going be able to beat the closing odds all the time. No matter how good his initial forecasting assumptions, the influence of late team changes and other unforeseen news that arguably arrives at a betting market randomly will easily turn expected value negative.
The relationship between the odds a bettor takes and Pinnacle’s closing odds has been shown to provide a very reliable measure of profit expectation.
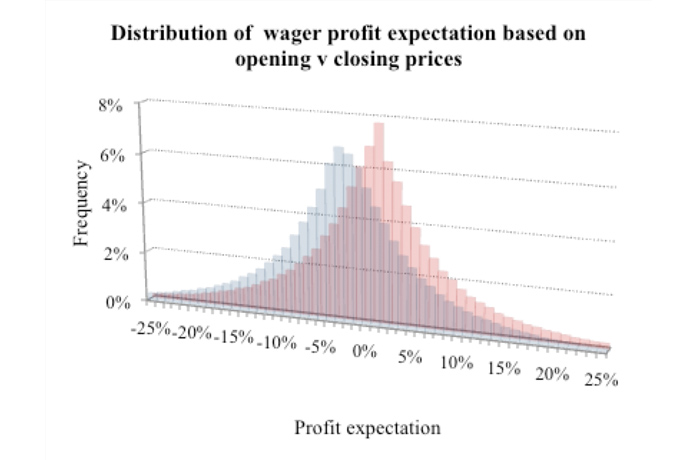
Assuming a bettor randomly picking teams to bet on, and that price movement, on average, is random, it’s reasonable to expect that they will beat the closing odds about 50% of the time. Indeed, analysing the same dataset of 132,645 soccer matches (and 397,935 outcomes on the home-draw-away match betting market) as for my previous article on this topic, we find a fairly random or normal distribution of Pinnacle’s opening to closing odds movements (defined by the ratio of opening to closing odds minus 1), with 45% of them greater than zero (the red distribution below).
The reason it’s a little under half is because Pinnacle’s closing margin is typically a little smaller than its opening one. Thus, where net market movement is zero between opening and closure, a closing price will still be a little longer than it’s opening one.

Once Pinnacle’s margin has been removed from the closing odds, we can see how much harder it is for the opening line to beat a ‘fair’ or ‘true’ closing price (the blue distribution above). For example, an opening line of 5.00 shortening to 4.90 by closing with an apparent profit expectation of 2% (5.00/4.90) in fact has no profit expectation.
It is important to note that in the example above, the fair price is probably about 5.05, once the favourite–longshot bias has been taken into account, greater than the opening price.
In fact, for our sample of soccer matches only 29.6% of the opening odds were longer than the ‘true’ closing line. Consequently, if our bettor were simply betting randomly they would be unable to beat it on more than two-thirds of occasions. In this sample of matches the profit expectation from fixed stakes wagering would be -3.5%.
Odds movement and expected value
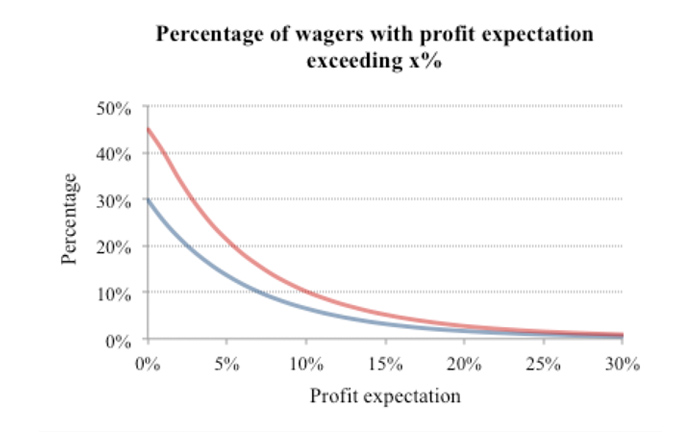
The chart below shows the percentage of wagers in our soccer match odds sample that exceed a specified profit expectation. The red line shows the implied profit expectation as calculated from the actual opening to closing odds movement. The blue line shows the implied expectation based on the movement relative to the ‘true’ closing prices, in other words with Pinnacle’s margin removed.
Really, it is the blue line we are interested in since this will be related to the actual profit we might expect to make if we can beat the ‘true’ closing price more often than random.

The chart illustrates how relatively few opportunities theoretically exist for significant expected value according to this model of odds movement. In our sample, just 6.5% of opening prices contain more than 10% implied profit expectation, with less than 2% holding more than 20% value.
To be showing profitable expectation we will unsurprisingly need to be beating the ‘true’ closing price at least 50% of the time.
Overconfidence by many bettors may encourage them to think they will always be able to find this value whilst avoiding the prices that hold none, but to reiterate the earlier point there is simply too much variance and noise in soccer forecasting for this to be credible. To consistently find enough of this value to become a winner takes a lot of hard work, as Pinnacle has previously explained by means of the Pareto Principle of Prediction.
How often do you need to beat the closing line to be a winner?
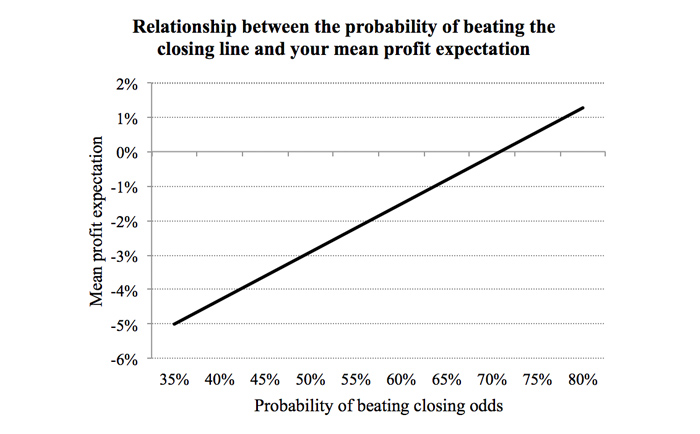
So just how often should we be beating the closing price to stand a chance of showing a profitable expectation? Randomly picking samples of 20 opening to closing odds movements and calculating their average profit expectations, the following chart constructed from this exercise gives us a clue.

In fact, we must be beating the published closing odds almost three-quarters of the time before we have a reasonable expectation of becoming a winner. If we had managed to bet all those opening prices that beat their closing counterparts in this sample whilst avoiding all the rest, our theoretical expectation would still be just +4%.
We should remind ourselves that beating the published closing price doesn’t imply we’re beating the ‘true’ closing price, as the earlier charts will have made clear. Indeed, in this sample we would still have failed to beat the ‘true’ closing price 34% of the time despite a perfect record over the published closing price.
To be showing profitable expectation, we will unsurprisingly need to be beating the ‘true’ closing price at least 50% of the time. The table below compares the proportion of occasions we might beat the published closing price with the proportion of occasions we’ll beat its ‘true’ price counterpart (once the margin has been removed).
What does this mean for betting expectations?
Naturally, this analysis relating the probability of beating the closing price to the size of bettor’s profit expectation is theoretical. It’s not based on any results, rather purely average expectation and the credible hypothesis that the amount a price moves offers an accurate predictor of how much profit a bettor can expect to make. Nevertheless, it hopefully provides another salutary lesson for bettors trying to understand their betting expectations.
The key to becoming a winner at Pinnacle is not focusing on results (which can be lucky or unlucky) but concentrating on value and beating the closing line. This article has provided clues as to how often you might have to manage this to achieve that goal.
MORE: TOP 100 Online Bookmakers >>>
MORE: TOP 20 Bookmakers that accept U.S. players >>>
MORE: TOP 20 Bookmakers that accept Cryptocurrency >>>
Source: pinnacle.com
