
David Sumpter, a professor of Applied Mathematics, explained the process of building a betting model based on under-priced draws in part one of this article. Now, he analyses whether expected goals can be used to beat the bookmaker’s odds. Can it be done? Read on and find out.
Expected goals: An overview
The soccer model that has got the most attention over the last few years is undoubtedly expected goals. The idea behind expected goals is simple: it measures the quality of chances.
If a player shoots from within the 6-yard box then we intuitively know that it has a better chance of being successful than if he blasts a shot from 30 yards. Expected goals turns our intuition into probabilities. Every chance is assigned a probability of being a goal.
There’s plenty of material explaining the details of expected goals, but there is one important point I want to emphasise: the absolutely most important aspect of the model is where the shot is taken from.
Look at the balloons emanating from the goal in the picture below. They show the probability of scoring given a chance within the balloon. Further out than shown in the diagram, the chance is about 3%.
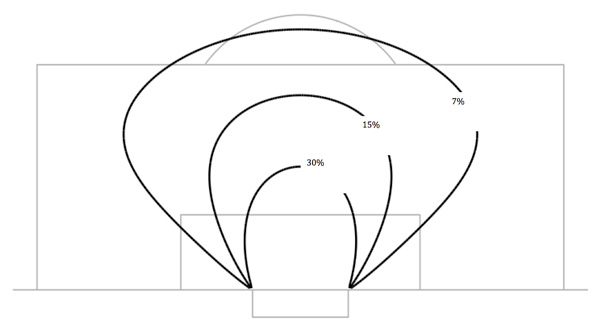
Given this, you can make your own expected goals model for your team while you are watching the match. Just count the chances they had within each balloon.
If they had two chances inside the 30% balloon, one chance inside 15%, five chances inside the 7% balloon and ten chances outside the balloons then their expected goals is:
2×0.30 + 1×0.15 + 5×0.07 + 10×0.03 = 0.855 xG
The expected goals model I have developed is a bit more complicated than this. I add whether a chance is a counter attack, a header, a ‘big chance’ and a few other factors. These do improve the model as it is spanned further than just shot location, but shot location is the right place to start when creating an expected goals model.
Expected goals: Can it beat the soccer odds?
The question for any betting model is whether or not it beats the odds. As I wrote in part one, I am sceptical about a magic formula for betting. So can expected goals provide the solution? Can it beat the soccer odds?
To answer this question we first have to start by looking at the soccer odds. When I want to see if I can find biases in the soccer odds I usually start with a statistical model called logistic regression.
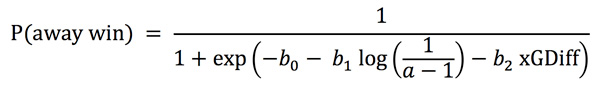
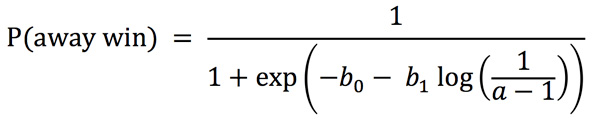 The idea behind regression is to see how well the soccer odds predict the match outcome. Imagine we are looking at the probability of an away win.
To do this we fit the model to the probability of winning away, where a is the bookmaker’s odds for the away win (in the Decimal odds format and corrected to remove the bookmaker’s margin) and is a constant. If you aren’t familiar with logistic regression there are plenty of online guidesexplaining.
Logistical regression: An example
Below is one example of a logistic regression for the last two seasons of the Premier League (2015/16 and 2016/17).
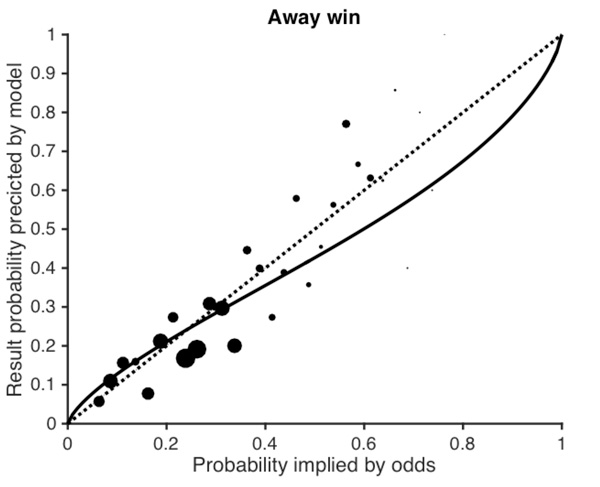
The size of the dots here are proportional to the number of times these odds were offered. The larger the dots, the more common these particular odds are.
The main message is not the suggestions provided by the model, but the method. If you want to build a model and win money betting on soccer, always start with the odds.
If these circles lie underneath the dotted line then the probability of an away win was smaller than the odds predicted. If the circles lie over the line then the probability of an away win was larger than the odds predicted.
The solid line is the best fit for the data. This line tells us is the overall trend. If you look carefully at the curve for probabilities predicted around 0.1, corresponding to odds of around 10.0, you’ll see that the curve lies slightly above the line, while for probabilities predicted over 0.25 the trend is reversed.
This tells us that over the last two seasons underdogs have won away from home and favourites have lost away from home more often than the bookmaker’s odds expected.
Underrated underdogs and overrated favourites
If there is value to be found over the last two seasons it is in predicting which underdogs will win away and which favourites will fail to win. It is here we can use expected goals. I did a new logistic regression with the following form:
I have now added the variable xGDiff. This variable is the expected goal difference between the two teams, calculated by looking at the teams’ average expected goals over the last 5 matches:
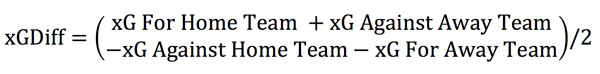
Performing this logistic regression, I found that teams playing away but with a more favourable xGDiff difference were more likely to win than the odds suggested.
So if we can find an underdog playing away with strong xG then the underdog is worth backing. Favourites playing away with a weak xG should be shorted.
Logistic regression: Expected goals inclusion
Below is an expected goals table for the current season (2017/18) as of week 11.
Here, we can use the WBA vs. Chelsea match to test the model. The xGDiff for these teams is:
(8.3+11.9 - 12.7-11.9)/2 = -2.7
Per match, this is -0.25. Chelsea were the favourites, with odds of a=1.62* when this article was written. Substituting these odds and xGDiff into equation (2) gives P(away win)=42% (with parameters b0=-0.49 b=0.75 and b2=0.73 fitted using previous seasons’ data).
So while the odds suggest a 62% chance of Chelsea winning, the model suggests the probability is much lower. The best bet is for Chelsea not to win.
Expected goals turns our intuition into probabilities. Every chance is assigned a probability of being a goal.
Another fixture that stands out from the above table is Southampton away to Liverpool. The xGDiff for these teams is 0.36 in Liverpool’s favour, which means they are favourites. But the odds for a Southampton win are 8.3, implying a win probability of 12%.
My model gives them a 15% chance of winning. This suggests that the Southampton win would be worth a bet, although remember that even if the model is right you will only win 15% of the time.
Lessons learnt from the model
The main message is not the suggestions provided by the model (both WBA and Southampton lost), but the method. If you want to build a modeland win money betting on soccer, always start with the odds.
First, use logistic regression to find inconsistencies in the odds, then add in variables (such as expected goals) to see if you can get an edge. This edge will be small, but it could well pay off in the long term.
MORE: TOP 100 Online Bookmakers >>>
MORE: TOP 20 Bookmakers that accept U.S. players >>>
MORE: TOP 20 Bookmakers that accept Cryptocurrency >>>
Source: pinnacle.com