
In order to have a successful betting model, all bettors should collect as much data as possible. But just how well does data fit into certain expected scenarios? Dominic Cortis explains how important ‘the goodness of fit’ is in analysing data.

Modelling and testing results involves a comparison of expected values in a utopian environment with the actual observed values. Pinnacle Sports Pulse magazine has published numberous articles on types of distributions and outcomes. In a previous article, I discussed that one of the possible errors is that the correct model is used but incorrect parameters are applied, for example due to a small sample with a large value.
In technical jargon, we are measuring ‘the goodness of fit’: that is how well the observed data fits to the expected scenario.
This is anomalous to finding the correct size shape (not the type of shape), as explained in this ‘errors in models’ article. One of the simpler measure to measure this is the χ2 test - read as the ‘Chi-Square’ test.
The roll of a dice
If a die is tossed 60 times, we expect 10 observations of each number (1, 2, …, 6). We shouldn’t fall for the gambler’s fallacy, in that after 10 occurrences of the number 2 after 40 throws - we can’t say that it will not come up again.
So if a die has had 9, 11, 10, 9, 12 and 9 observations of 1, 2, 3, 4, 5 and 6 respectively, can we say that this die is biased? After all, this is different from 10 observations for each number but the key issue is whether it is significantly different.
The deviation, being the difference between the observed and expected values, ranges between -2 and 1, as can be seen in the table below.
| Value | 1 | 2 | 3 | 4 | 5 | 6 |
| Expected = E | 10 | 10 | 10 | 10 | 10 | 10 |
| Observed = O | 9 | 11 | 10 | 9 | 12 | 9 |
| Deviation = E - O | 1 | -1 | 0 | 1 | -2 | 1 |
| [E – O]² ÷ E | 0.1 | 0.1 | 0 | 0.1 | 0.4 | 0.1 |
What we are interested in is a measure of overall deviation to see how different the die is from the utopian scenario. The addition of deviations is 0, since both observed and expected values add up to 60 throws.
There is a multitude of ways of dealing with this, such as using absolute values (i.e. make all values positive) or percentage differences.
However for ‘nice’ mathematical properties, we will measure the relative change in square deviation. That is by squaring each deviation and dividing it by the expected value.
For example, for the 12 observations of the number 5, we have 2^2 ÷ 10 = 0.4. If we add all these values we obtain our χ2 of 0.8.
The ‘Chi-Square’ test
The χ2 measures the overall discrepancy between expected and observed frequencies: the bigger it is, the more evidence of a difference between the two. While we can measure this to exact precision, for the sake of simplicity, we will use a cut off point.
These can be found in any statistical tables and using the Royal Statistical Society set of tables (page 6), we find many cut off points. Let us use the column 0.05, referring to a 5% significance level.
While the normal distribution is based on two parameters (mean and standard deviation) and the Poisson distribution on one parameter (the mean), the Chi-Square distribution is based on one parameter: the degree of freedom.
In this case, we have 6 possible outcomes and therefore the value we’d need is where the degrees of freedom (v) is one less, 5. Our critical χ2 , that is the value that a χ2 should exceed to have evidence of a difference, is 11.070.
Since our value is much lower, then there is no evidence of this die being different.
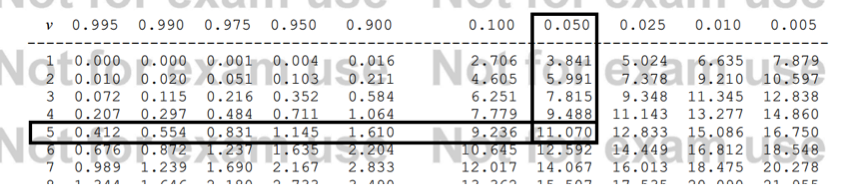
Figure 1: Chi Square Table in Royal Statistical Society Statistical Tables
As this is slightly time-consuming, we have also built a small app below that lets you compare observed with expected values.
Check out the results if the observed values were ten-fold (Observed = 90, 110, …; Expected = 100 each) or 100-fold (900,1100, …) – you should notice that although similar proportions, there is evidence of a die being an unfair one for larger samples. This is because a small deviation is possible but a consistent one is stronger evidence of divergence.
Limitations
This leads to a key limitation to this test: it provides evidence (not proof) of a difference but lack of evidence of a difference doesn’t mean they are the same. Furthermore the app above only uses a 5% significance level. This would correspond to considering discrepancies that should occur in less than 1 in 20 cases under a utopian scenario as a sign of a difference. Finally a Chi-Square test needs at least 5 values expected for each category.
Try it for yourself.
The Chi-Square Test App
| Observed | Expected |
|---|---|
Results
MORE: TOP 100 Online Bookmakers >>>
MORE: TOP 20 Bookmakers that accept U.S. players >>>
MORE: TOP 20 Bookmakers that accept Cryptocurrency >>>
Source: pinnacle.com