
What models do you use to guide your bets? If you haven’t heard of Monte Carlo simulation you could be missing out.
There are various ways to solve a real-life conundrum numerically; however we are usually accustomed to a traditional manner – a function. A function is the relationship between a set of inputs and permissible outputs with the value that each input is related to exactly one output.
For example, consider calculating the probability of Lewis Hamilton winning the Japanese Grand Prix. One way of doing this is to build a function with input parameters that affect performance such as results in the last races etc. A similar strategy can be applied for soccer, which often uses Poisson estimates of goal rates for each team - this article explains using a Poisson approach to calculate game outcomes.
However what if bettors want to calculate the probability of Hamilton winning the Formula 1 2014 season? The outcomes for this query are far more complex, and cannot be solved by a simple function. This is where mathematical models can be used.
Deterministic Model
A deterministic model is similar to a function: the output is relatively easy to calculate given that all inputs are known. However, calculating Hamilton’s chance to win the season needs a more technical / intricate approach.
Stochastic Model
One-way of doing this is to simulate the results of the remaining five Grand Prix - Japan, Russia, US, Brazil & Abu Dhabi - via a Monte Carlo simulation, which is a technique that uses randomly generated numbers in order to approximate the outcome. This is a Stochastic Modelwhere we have many random variables -rather than one simple function - and need to obtain a range of results.
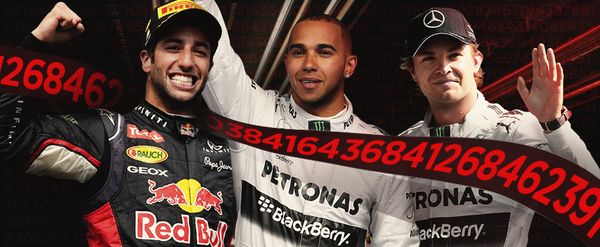
At the time of writing the Mercedes drivers Hamilton (1.568* to win the drivers’ championship) and Nico Rosberg (2.510*) are one and two in the world championship while Daniel Ricciardo (51.240*) is third, 60 points behind Hamilton.
Technically even sixth placed Valtteri Bottas can win the championship as there are 150 points still up for grabs since the winner of each race gets 25 points and the last race counts double points. For simplicity’s sake, we can assume that only the top three have a realistic shot at winning the championship.
Bettors should therefore simulate all top ten positions – the positions drivers earn points from - but for this article we will just simulate the winner and the runner-up.
If any of the three drivers fail to finish inside the top two, then we will assume they would have obtained six points, which is close to the average of points he would have scored had he crossed the chequered line between third (15 points) and eleventh (0 points) position. For example, if in a simulation, Hamilton is ranked first (25 points) and Rosberg second (18 points); then Ricciardo is given 6 points.
Rosberg, Hamilton and Ricciardo have won 4, 7 and 3 of the 14 Grand Prix held to date in 2014. We can therefore use the ratio of strength 4:7:3:1 for the drivers Rosberg:Hamilton:Ricciardo:Others.
In this case, we have 13 possible outcomes (denoted A to M) for each race. For example in outcome I – in the table below - sees Ricciardo win the race while a driver other than the Mercedes team obtains second place. The probability of Ricciardo winning the race is 3/15 since the ratio is 4:7:3:1 while the probability of neither Hamilton nor Rosberg finishing second is 1/12 since the ratio would now exclude Ricciardo and his 4:7:1.
Therefore the probability of Ricciardo obtaining 25-points while the other two obtaining 6 points each is 3/15*1/12 = 1/60. The probability of each outcome as well the cumulative amounts are shown in the table below.
| Path | A | B | C | D | E | F | G | H | I | J | K | L | M |
|---|---|---|---|---|---|---|---|---|---|---|---|---|---|
| Rosberg | 25 | 25 | 25 | 18 | 6 | 6 | 18 | 6 | 6 | 18 | 6 | 6 | 6 |
| Hamilton | 18 | 6 | 6 | 25 | 25 | 25 | 6 | 18 | 6 | 6 | 18 | 6 | 6 |
| Ricciardo | 6 | 18 | 6 | 6 | 18 | 6 | 25 | 25 | 25 | 6 | 6 | 18 | 6 |
| Probability | 17.0% | 7.3% | 2.4% | 23.3% | 17.5% | 5.8% | 6.7% | 11.7% | 1.7% | 1.8% | 3.1% | 1.3% | 0.4% |
| Cumulative Probability | 17.0% | 24.2% | 26.7% | 50.0% | 67.5% | 73.3% | 80.0% | 91.7% | 93.3% | 95.1% | 98.2% | 99.6% | 100% |
The cumulative values can now be used to estimate the outcomes. There are five races remaining, so let us generate five random numbers between zero and one - this can be done in Excel using =rand ().
For each value, we use the table to estimate the points earned by these three drivers. For example if the first random number is 0.4215, which lies between 26.7% and 50.0%, we would simulate outcome D for the next race in Japan - Hamilton first, Rosberg second.
For each simulation, we add the current drivers’ world championship points to the points gained in the five simulated races. The winner is therefore the driver with most points.
You should repeat this procedure for a large number of simulations to ensure data is not insignificant as a reflection of small sample sizes. For example if Hamilton wins 4,000 times from 10,000 simulations, then his chance of winning the championship is 0.4 or 40%.
Dynamic Modelling
Dynamic modelling is where the parameters improve as the model is simulated.
In this illustration, the ratio of strength would change after each race is simulated, the data would factor in other variables such as form, momentum and car set-up etc.
For example, if the model expected Hamilton to win the Japanese GP, the system could factor in momentum for the next race in Russia. Therefore the ratio of strength for example would change to 4:8:3:1 for the Russian GP.
Conclusion
In conclusion there are three main stages to mathematical modelling: deterministic, stochastic and dynamic. The higher the stage, the more technical knowledge is required. Monte Carlo simulations can be used for the latter two with the key difference being the model learns from its own simulations in a dynamic setting.
In the end, the model based on probability distributions does not produce a definitive answer like your “gut guess”. Instead, the model’s answer is itself a probability distribution, which tells you the range of probable outcomes and their relative likelihood.
However similar to other models Monte Carlo has weaknesses. Given the data relies on variables to be entered into the system, bettors must ensure the information is accurate to avoid the “garbage in, garbage out” scenario. The key assumptions made here can all be criticised. For example:
- The ratio of strength doesn’t consider that different drivers and cars are better suited for particular race circuits and temperatures.
- The six points attributed is not necessarily realistic as this assumes each of these three drivers will get points from each race.
Ideally the sensitivity of results to these assumptions is tested. It only takes poor information to skew the system, which is why Monte Carlo models should be used alongside a balanced betting strategy and not solely relied upon.
In addition, bettors should always use the best odds, which Pinnacle Sports offer - read here about our unbeatable odds - and given we offer the highest limits online, a bet with us will ensure you are best placed to get the best value for your bet.
Dominic Cortis is a lecturer with the Department of Mathematics at The University of Leicester; and an assistant lecturer at The University of Malta. He is an associate actuary and his research focuses on sports analytics as well as financial and betting derivatives.
MORE: TOP 100 Online Bookmakers >>>
MORE: TOP 20 Bookmakers that accept U.S. players >>>
MORE: TOP 20 Bookmakers that accept Cryptocurrency >>>
Source: pinnacle.com