
Using data as part of a betting strategy is common practice. However, as impressive as some results may appear, the process of producing such results is the important part. What are the problems with data mining in sports betting? Read on to find out.

Over the past few months, I’ve come across a sizeable number of websites, blogs and forum posts which claim to have uncovered profitable betting systems simply from retrospectively applying a few seemingly arbitrary selection criteria to a large data set of historical results and betting odds.
In this article I investigate the pitfalls of searching for a profitable advantage via data mining: for the sports bettor, correlation without causation spells trouble.
Data mining and dredging
Data mining involves the process of analysing large sets of data to uncover patterns and information. More specifically, the task of data dredging is the use of data mining to uncover patterns in that data which can be presented as statistically significant.
We can’t retrofit an explanation on the back of an outcome since this is turning causality on its head.
Sporting betting lends itself easily to data mining and dredging. Various websites make large volumes of historical football results and betting odds available for the purposes of retrospectively searching for and testing profitable betting systems.
The major limitation of using this as a data analysis tool, however, is that priori hypotheses to account for why those patterns might have occurred are typically not proposed.
Correlation without causation
I have previously discussed the pitfalls of confusing correlation with causation, precision with accuracy and validity. For a betting system to be valid and really doing what it is supposed to be doing we must have some idea about what causes its success in the first place.
Unless you establish the causation behind the correlation, you will have no idea what might cause your correlation to break down - correlation without causation is meaningless.
Hidden value in English League Two soccer?
On my twitter feed a few weeks ago, my attention was drawn to the outstanding returns one could have realised by blindly betting on all away wins in English League 2 from 2012/13 to 2016/17 inclusive – approaching 3,000 wagers – amounting to 4.3% from closing Pinnacle odds and nearly 10% from best market prices.
Only one of those five seasons witnessed a loss to Pinnacle’s closing prices, and that was small. The profit chart looks like this.
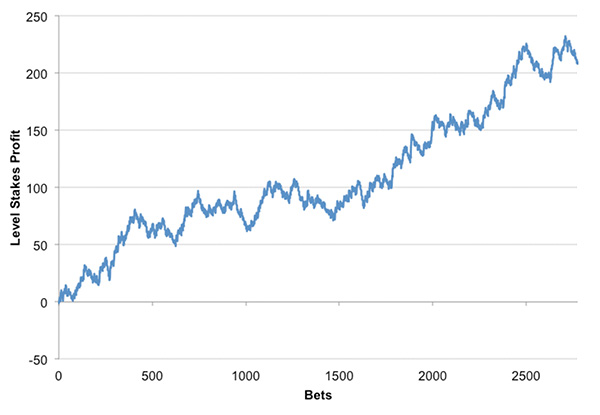
The suggestion was that the market was undervaluing away teams in this division, that is to say they were overpriced. This is not some short-term aberration, however; rather it would appear to be a consistent and systematic error in the way bettors had underestimated the likelihood of away wins in English League 2, far beyond the boundaries of the bookmaker’s profit margin. But can we really believe there is anything causal in what we have found here?
Backing the Draw: It sounds so simple
Another strategy I’ve recently seen published is called Backing the Draw. It claims to have returned close to a 16% profit over turnover from over 2,500 wagers when tested retrospectively over soccer results and Pinnacle match betting odds back to 2012.
The selection criteria are simple: neither team should have drawn in the previous three games; odds should be in the range 3.20 to 3.56. Testing the statistical significance of this profit we find that record is indeed exceptional. We could expect such a level of profitability from these odds to occur perhaps just once in a million times or less assuming the pattern to be nothing but random.
One might well ask why these particular criteria have been chosen. Why not the previous four, five or six games? Why not odds 3.07 to 3.41, or 3.13 to 3.72? Of course, these criteria were almost certainly not chosen before the data were mined; they were simply found to have produced the profitable outcome they did. And we can’t retrofit an explanation on the back of an outcome since this is turning causality on its head.
Unless you establish the causation behind the correlation, you will have no idea what might cause your correlation to break down.
In defence of this strategy you might now also say; “one-in-a-million: surely that must mean this isn’t random, right?” Yes, true. However, if we have a million strategies to test, and we find one of them as statistically significant as this, what is that telling us? As Nassim Taleb, in Fooled by Randomness, narrates on the fantasy of monkeys attempting to recreate the poetry of Homer on a typewriter:
“If there are five monkeys in the game, I would be rather impressed with the Iliad writer, to the point of suspecting him to be a reincarnation of the ancient poet. If there are a billion to the power one billion monkeys I would be less impressed…”
As Taleb points out, not many people bother to count all the monkeys, and if they did barely any of them would make interesting patterns worth talking about. Survivorship bias ensures we only get to see the winners.
Why bettors need to “count the monkeys”
If we won’t propose priori hypotheses before dredging our data in search of profitable patterns, then instead we should test a large number of betting systems to see how often we find statistical significance. As I replied to this discussion on my twitter feed, “let’s plot the distribution of yields from 10,000 samples of blind bets selected according to 10,000 different criteria and see what it looks like.”
Well, I couldn’t find 10,000 samples of blind bets of suitable size – that would involve a lot of data – but rather 1,686 of them of 100 wagers or more. Each sample represented a season of blind betting on a particular result, home, draw or away, for a single soccer league over a single season.
Having first removed Pinnacle’s profit margin to calculate the ‘true’ prices for each outcome, I then calculated the theoretical returns for each sample and their t-statistic, my preferred measure for how unlikely such returns could arise by chance. These are plotted in the distribution below. Positive t-scores represent profitable samples, negative scores loss-making; the larger the number, the more unlikely it is.
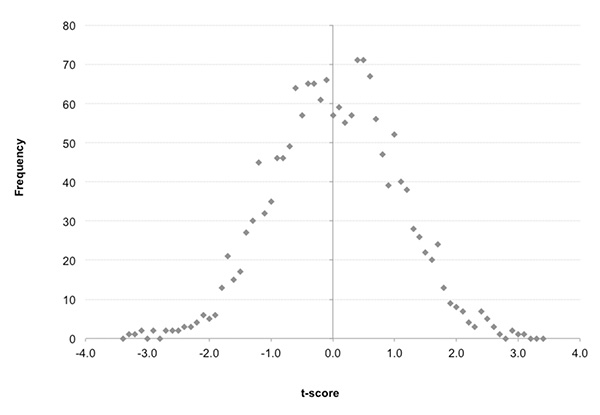
Those of you familiar with the normal distribution (bell-shaped curve) will recognise it as evidence of randomness. That is to say, the performance of these samples of blind bets conforms closely to what we would expect to happen if everything was subject to chance only.
Taken as a whole, there is evidently little or nothing systematic happening at all. Those profitable seasons in English League 2 were most probably just lucky performances uncovered by messing around with data and stumbling upon something that looked like a profitable pattern caused by systematically irrational bettor or bookmaker behaviour.
The ‘true’ odds returns for the five seasons taken together would have a t-score of +2.4, implying about a 1-in-100 probability (p-value) that it would happen by chance. Statistically, that is significant and if we were publishing an academic paper about it in isolation we would be motivated to call it something real. But we know that from analysing the bigger picture it almost certainly isn’t, it’s just blind luck.
If we set about devising a betting system via data dredging until we find criteria that are profitable, we risk failing to establish causal explanations for what we find.
In fact a sample from the 2007/08 season for English League 2 performed even better. The 242 matches for which I have data for from December through to May showed a theoretical profit of over 29% (or 35% from ‘true’ odds with the margin removed). Such a performance could be expected by chance about 1-in-1000 times. It was the best performance out of the 1,686 samples.
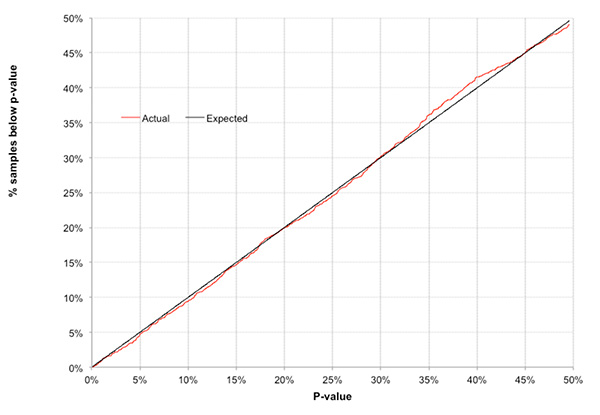
In total, 837, or about half, of them were profitable to ‘true’ odds, just as expected. In such a sample of samples, we would naturally expect the best one to show a p-value of around 1-in-1686. We’d expect about 16 of the samples (or about 1%) to have p-values of less than 1-in-100. Similarly, we’d expect about 168 samples (or about 10%) to have p-values of less than 1-in 10. Anything different and we might rightly wonder if any of them were being influenced by anything other than luck.
In fact there were 15 (0.9%) and 158 (9.4%) respectively, pretty close to expectation. The chart below compares theoretical expectation of the percentage of profitable samples with p-values below a particular threshold (1-in-10 = 10%, 1-in-5 = 20% and so on) with the actual percentage occurring. The almost perfect equivalence is striking.
Essentially, the chart is another way of saying that almost everything we are looking at has arisen because of chance and chance only. Yes, a 1-in-1000 profitability is impressive, but if we have over 1,000 samples to choose from, it’s not unexpected, and hence it’s not strong evidence of anything causal.
What can bettors learn about data mining and dredging?
It’s perhaps not unsurprising that the distribution of profitability by seasonal soccer division is random. It’s hardly the most sophisticated means of devising a betting system. But the significant point is this: if we set about devising a betting system via data dredging until we find criteria that are profitable, we risk failing to establish causal explanations for what we find.
Unless we have a reason for why that profit happened, it might just be complete rubbish. Correlation without causation simply regresses to the mean. For a sports bettor that means losing money over the long term.
One might argue there’s nothing wrong in taking advantage of luck to make a profit; after all, that’s what betting is about. When we do that, however, we shouldn’t deceive ourselves by assuming that our success is a consequence of anything else.
MORE: TOP 100 Online Bookmakers >>>
MORE: TOP 20 Bookmakers that accept U.S. players >>>
MORE: TOP 20 Bookmakers that accept Cryptocurrency >>>
Source: pinnacle.com