
The most popular way to assess data for betting purposes is to use an average, but is it the most useful? The mode and median often provide a more suitable alternative, so understanding them is crucial for successful betting.
The ‘average’ problem for bettors
Because of its simplicity many sports bettors use the average to quantify a performance statistically. But how many are aware of its limitations?
For instance, when betting on the Total goals market for a soccer game, bettors may believe that by calculating the average number of goals scored over previous games, it provides an accurate gauge of the number of goals expected in a future match. But is this average measure really appropriate?
Although the average gives an overall picture, it doesn’t account for the shape of the distribution
As an example lets look at the number of goals scored in the Premier League compared to La Liga in the 2013/14 season. The average goals scored per game for each league is 2.77 and 2.75 respectively. This may lead bettors to assume that La Liga games scoring less than 2.5 goals is more frequent than in the EPL. Nevertheless, this is not the case - 48.4% of EPL games go under 2.5 goals compared to 47.3% in La Liga.
By looking at the figure below, it is evident that while the distribution of numbers is similar, the most frequent number of goals scored in the Premier League is two goals per game, compared to three in La Liga. The average masks this fact.
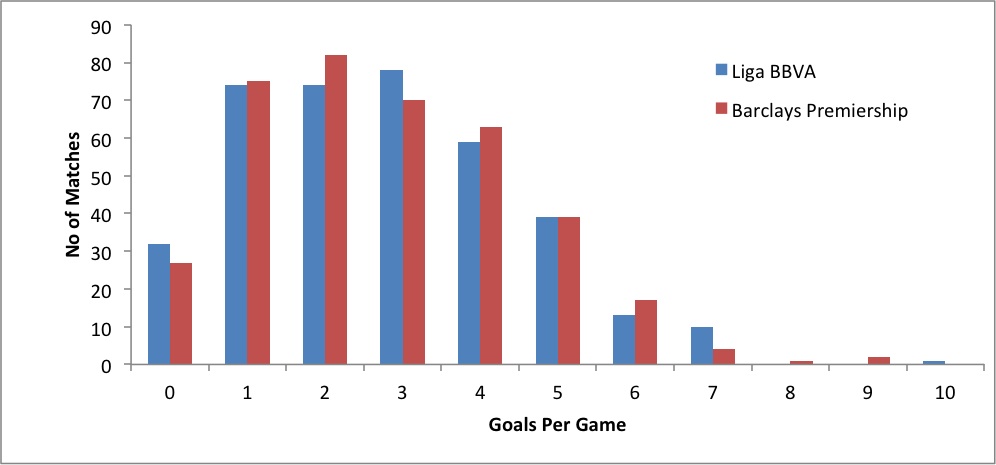
So why is this? Although the average gives an overall picture, it doesn’t account for the shape of the distribution.
Another example of the dangers of average measures is using them to assess handicaps for International soccer minnow nations, who are considered the ‘whipping boys’ for each qualification campaign. But are they really as bad as they appear? While averaging a nations goal per game total could result in big numbers, this sum may have been severely skewed by less frequent but heavy defeats, and as a result, lead bettors to potentially overvaluing the number of goals they expect to see.
Below we investigate alternatives to the average – mode and median – and use three sets of numbers to highlight two scenarios in which the average may not be adequate.
Consider the following sets of numbers, each of which have an average of five.
- Set A: 4, 5, 5, 5, 6
- Set B: 3, 4, 4, 4, 10
- Set C: 3, 4, 5, 6, 7
First Scenario: Having outliers on the higher/lower end
Although the three sets have the same average and all add up to 25, their distribution is quite different.
Set A can be classed as symmetrically distributed - there is one number on each end of the average, since 4 is below and 6 is above the average.
The average or mean is ideal to use when faced with a symmetric distribution - a situation where the values of variables occur at similar frequencies on both ends of the average, and the average lies in the middle of the set of values.
In contrast set B has four numbers below the average, and only one above. This can be described as a skewed distribution.
By understanding the limitations of the average bettors should be better placed to judge its suitability as a measure for prediction
When using a large data set, bettors can test the suitability of the average by using other measures such as the median or mode.
The median is the value that lies in the middle of a distribution when arranged in ascending or descending order. In sets A and B, this is five and four respectively. The mode is the most popular value, which is also five and four respectively.
A symmetric distribution should have a similar arithmetic mean, median and mode. The difference between the latter two and the arithmetic mean in set B indicates that this is a skewed distribution and therefore the average is not an ideal measure.
Second Scenario: Different Spread
Two sets may both be symmetrically distributed but not equally spread. For example, just like set A, set C is also symmetrically distributed because it has equal numbers below and above the average; and the difference from the mean is similar on both ends.
Yet while both are adequately summarized by an average of five, this average is a better measure for set A since more numbers are closer to the arithmetic mean. The difference between the two sets lay in the dispersion within the group. We therefore need to measure the dispersion.
To do this, bettors can calculate the range and the standard deviation. The range - the difference between the maximum and the minimum value - is easy to compute. On the other hand standard deviation is more complicated. In basic terms, and for the relevance of this article, it measures the variation in a set of data from the average. Please note we will be writing an article looking into distributions in greater detail, and we will explain standard deviation in greater detail there - this article is available here.
Sets A and C have ranges of two and four respectively while their standard deviation is 0.71 and 1.58 respectively. As both measures are bigger for set C, we have further indication that there is more difference within the latter group.
Conclusion
By understanding the limitations of the average - skewed distributions and differing measures of dispersion - bettors should be better placed to judge its suitability as a measure for prediction. Albeit not a thorough investigation into the adequacy of using the average, this should be enough to advise caution and consider other measures.
Dominic Cortis is a lecturer with the Department of Mathematics at The University of Leicester; and an assistant lecturer at The University of Malta. He is an associate actuary and his research focuses on sports analytics as well as financial and betting derivatives.
MORE: TOP 100 Online Bookmakers >>>
MORE: TOP 20 Bookmakers that accept U.S. players >>>
MORE: TOP 20 Bookmakers that accept Cryptocurrency >>>
Source: pinnacle.com