
For those of us who use tipsters to find positive expectation there are two important questions. Is the tipster lucky or skilled? And is the track record genuine? We have previously investigated how to evaluate a tipster’s ability and how to test a betting record for evidence of predictive skill over luck. Now we look at how you can assess a record’s credibility. Read on to find out.

Pinnacle has previously investigated how to evaluate a tipster’s ability and how to test a betting record for evidence of predictive skill over luck. But once you have your hands on a tipster’s seemingly credible record, how do you know that it is still a good deal for you to invest your money in? Let’s find out.
The t-test revisited
Previously, I’ve discussed how the t-test can help look for evidence of forecasting skill, by investigating the likelihood that a profit from a series of wagers could have happened by chance. The smaller that probability the greater the likelihood that something else, like skill, might have caused it. However, when a betting record looks too good to be true, we might arrive at a different conclusion: a manipulated record.
Consider the history from an online soccer tipster specialising in over/under and match odds markets, offering customers “quality tips, great odds and BIG winnings.” Between August 2013 and October 2014, prior to submitting his picks to a well-known tipster surveillance service (since discontinued due to allegations of misconduct), there were 296 of them, with an average win expectation of 50% and average odds of 2.04. 220 of them were winners, for a strike rate of 74% and a return on investment of 151%. The profit chart looks like this:
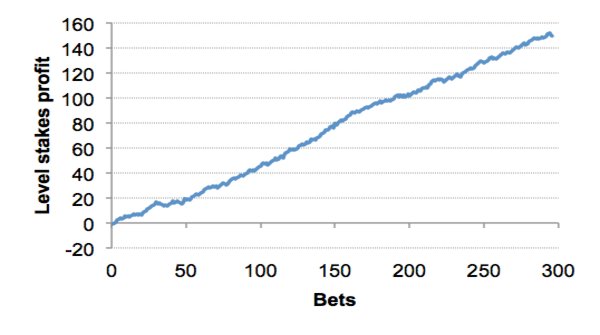
With a t-score of 9.3, such a record of profitability could be expected to happen by chance roughly once in a million trillion times. The improbability of such an event and the near-perfect profit trend that verges on the impossible should set alarm bells ringing. Nevertheless, such a result does not prove that the tipster is cheating. He could yet be the most supremely talented forecaster. How, then, can we test that proposition?
Method 1: Study the closing prices
Mirio Mella has previously talked about the significance of market movement. Prices adjust as bettors express their opinions with money, reflecting the available news about teams or players. The greater the interest in a particular team or player is, the greater the likelihood that their odds will shorten. Dafni Serdari also explains why the closing price is important.
“The odds offered just before a game begins are called the closing line and reflect all statistics, news, wagering activities and market sentiment. The closing line should be the most efficient point of the market, and therefore the most accurate representation of underlying probability.”
Bettors who consistently beat the closing price are considered to be sharp. They have brought information to the market, which is reflected in their ability to shorten the odds. Where they consistently beat the closing price by more than the margin, this is a sign of positive expectation and helps distinguish winning from losing players, or sharps from squares.
I’ve previously analysed a large sample of opening and closing prices. This unequivocally demonstrates that the margin by which you beat the closing price is an excellent predictor of your profit expectation. For example, if you bet a price of 2.20 on a team which closes at 2.00, your predicted advantage will be 10% (minus the margin).
Does our “quality tipster” consistently beat the closing price? With a profit expectation of 51% we should expect to see odds of 2.00 shorten by 51% plus the margin to about 1.30. Inspecting the tipster’s final 20 tips advised with Pinnacle in the study sample we find the following.
- 8 prices shorten (average 6.7%, largest 19.5%)
- 7 prices lengthen (average (3.5%, largest 7.1%)
- 5 stay the same
- Average movement was a 1.5% shortening
- Typical margin is 2%
There is no statistically significant difference between this and randomness. This tipster is not moving Pinnacle’s market in any systematic manner. Indeed, he’s not even covering the margin. Evidently, when he was advising his tips, Pinnacle was not taking notice.
Method 2: The Wald–Wolfowitz runs test for randomness
A second method we can use to test the credibility of a tipster’s betting history is the Wald–Wolfowitz runs test for randomness. Named after Abraham Wald (the statistician who discovered survivorship bias) and Jacob Wolfowitz, this test determines whether a binary data sequence arises from a random process.
Regardless of any signal arising from the tipster’s skill, sequences of wins and losses should still reflect the underlying random noise in the history, since each sequential bet is independent of the previous. A tipster advising even-money propositions with no forecasting skill would replicate a series of coin tosses. A tipster with a 74% strike rate would represent a weighted coin 74:26 in favour of heads over tails. We’ll see three times as many heads as tails, but the sequence distribution will still be random.
Consider the following sequence of wins and losses:
W W L L W L W W W W L W W L L L L L W W
There are 11 wins, 9 losses and 9 observed runs (Ro), where a run is defined as a series of consecutive wins or losses (including only one win or loss). Determining whether this sequence is random or otherwise, requires us to calculate the expected number of runs from 11 wins and 9 losses and compare this to the number observed. The bigger the difference, the less likely it is that the sequence is random. Under the (null) hypothesis that the sequence is random, the expected number of runs (Re) is given by:
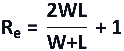
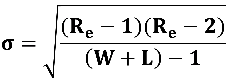
Where W and L are the number of wins and losses respectively. The distribution of possible runs is approximately normal with standard deviation (σ), given by:
We then calculate the test statistic (Z), defined by:
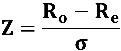
Finally, we convert this into a probability (the p-value) that the difference between the observed and expected number of runs could have arisen by chance. In Excel, this can be performed using the NORMSDIST function, as I have done with my own runs test calculator. The smaller the p-value, the greater the likelihood that the hypothesis of randomness and statistical independence of the win-loss sequence may be rejected. Typically this happens at p-value = 5% (Z = 1.96) or sometimes 1% (Z = 2.58).
For the sequence above Re = 10.9, Z = 0.88 and the p-value = 38%, from which we would conclude that the sequence is random.
A successful runs test rests on the assumption that the probability of each bet outcome is the same (as for a coin toss). Although this is typically not the case where odds for tips vary, it should not be violated excessively where they are broadly similar.
This will most commonly be true for Asian handicappers and point spreaders where odds show a narrow range around 2.00. For our tipster under analysis, 96% of his tips had win probabilities of between 40% and 60% with 78% between 45% and 55%. So what does a runs test say about his record?
- Number of tips (n) = 296
- Winners (W) = 220
- Losers (L) = 76
- Observed runs (Ro) = 135
- Expected runs (Re) = 114
- Z = 3.21
- P-value = 0.1%
From these results, we can confidently reject the hypothesis that the sequence is random. There are simply too many runs compared to expectation for a tipster with a 74% strike rate with average odds close to 2.00. A closer inspection reveals why the randomness test failed: an excess of shorter runs and a dearth of longer ones.
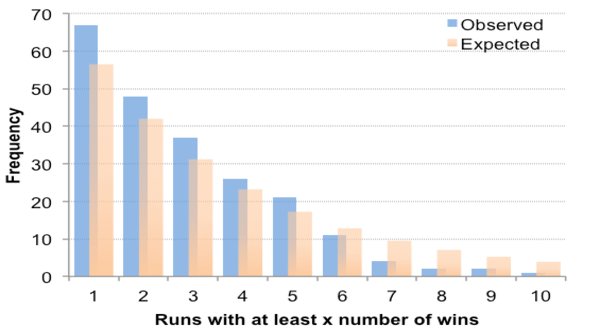
For example, there were 67 runs with at least 2 consecutive winners compared to an expectation of 56. By contrast, there were just 2 runs of at least 8 consecutive winners when expectation was 7.
Fooled by randomness
If this tips history is not random, what is it? The simplest explanation is that it has been manipulated. Given the excessive number of shorter winning runs, the likelihood is that the tipster has too often inserted a losing result to break up a longer winning sequence. Why?
We suffer a cognitive bias known as the clustering illusion, with a tendency to erroneously consider inevitable runs or clusters arising in random distributions to be meaningful. Consequently, when asked to actually create random binary sequences the majority will switch from W to L or vice versa, if they feel that one of them is happening too often.
Our tipster has evidently perceived long winning runs to look unnatural when the opposite is true. In fact in a sequence of 296 tips with a win expectation of 74% we should typically see at least one run of 15 wins. His largest was 11 with one other of 9 and two of 7.
Too good to be true?
If a tipster’s record looks too good to be true, it probably is. Before buying, test it for evidence of outperforming the closing odds and the presence of randomness in its sequences. If neither exists, keep your money in your wallet and move on.
With regards this “quality tipster”, another analysis of closing prices for his most recent tips shows he’s still not influencing Pinnacle’s market at all. Furthermore, he’s now been shown to be altering past tips histories, inserting a series of losing tips presumably with a view to making the record look less impossible. A re-run of the Wald–Wolfowitz runs test will be able to determine if he’s still fooled by randomness. If he is, make sure you are not.
MORE: TOP 100 Online Bookmakers >>>
MORE: TOP 20 Bookmakers that accept U.S. players >>>
MORE: TOP 20 Bookmakers that accept Cryptocurrency >>>
Source: pinnacle.com