Earning a living from betting can be rewarding. However, as profitable as becoming a winning bettor can be, earning a regular salary from sports betting can be challenging. How often can winning bettors expect to get paid? Read on to find out.

In 2017, Pinnacle ran a Twitter Discussion Day where they gave advice about what is required to be a professional bettor. Some of the things discussed included staking and money management, the value of information, understanding the difference between picking winners and finding expected value and the importance of the closing odds in measuring success.
One aspect that was missing was an assessment of what the business of making a profit actually looks like, and specifically how often a winner can expect to make one. The simplest way to measure this is to consider professional sports betting as just another job.
Most forms of employment manage to pay on a monthly basis. This article will investigate how often a winning sports bettor can expect to get a monthly pay packet.
How often will your bankroll reach new highs?
One of the earliest inspirations of my chosen career path as a sports betting analyst was an article published by the website Professional Gambler entitled Sports Betting Money Management. It was revealing as it didn’t attempt to deceive the reader with impossible returns, strike rates and profit growth.
Sports betting is a hard business to succeed in; even the best professionals playing handicap or spread markets only achieve strikes rates of 55 to 57%, with returns rarely exceeding 110% over the long term.
Perhaps the most surprising feature of the article was the observation that a handicapper with a 55% strike rate could expect to see their bankroll reach new highs only 5% of the time. To quote R.J. Miller, the author of the article and professional gambler, “[t]he novice thinks you should have more money each day.” In fact “19 out of 20 days you will be below your bankroll high.”
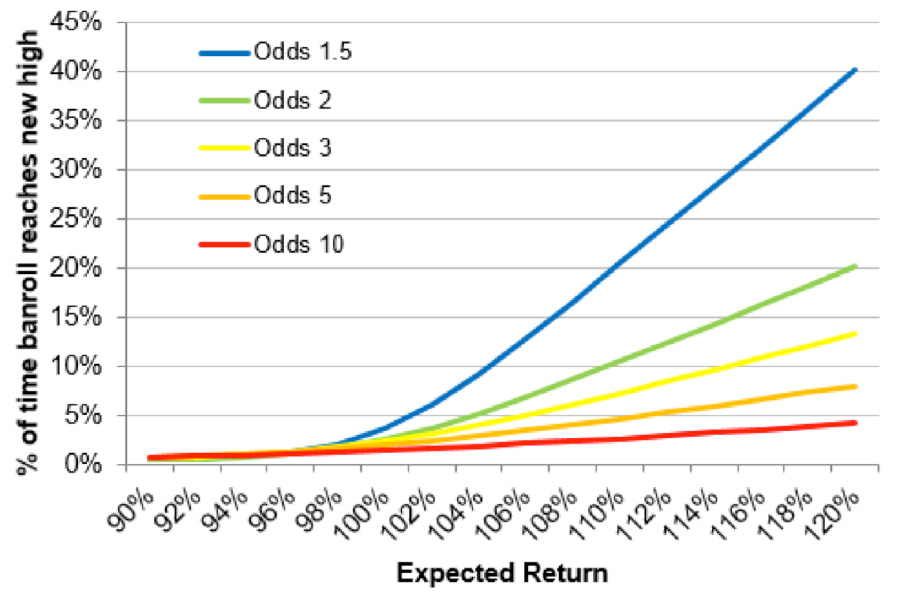
For this article I decided to test this supposition over a range of betting odds (1.50, 2.00, 3.00, 5.00 and 10.00) and return percentages (90% through to 120% at 2% intervals). The expected probability of reaching a new bankroll high was modelled by means of Monte Carlo simulation. The results have been plotted in the chart below:
At the time R.J. Miller wrote his article, typical handicap odds were -110 (American), equivalent to 10/11 (fractional) or 1.91 (decimal).
A 55% strike rate would thus have translated into a 105% return. The best fit line for these figures is the green line above (odds of 2), and indeed we find that for such a return we can expect to achieve bankroll highs just 5% of the time.
It is also revealing just how infrequently we can expect bankroll highs even if our performance is considerably better. Even with a long-term return of 120%, unheard of in the legitimate circles of sports betting at these betting odds, we would still only be achieving highs just 20% of the time. At longer odds, it would be even rarer to achieve those highs.
Monthly returns
The nine charts below show possible monthly betting histories each of 50 handicap even-money level-stakes wagers and a theoretical strike rate of 55%, equivalent to a profit expectation, p, of 10%, or an expected return on investment, r, of 110%.
Even with a very healthy advantage over the odds, three histories finished with losses. Imagine not getting paid two or three times in a calendar year, and worse still having to pay your employer for not working hard enough. Anyone who says sports betting is easy is misinformed.
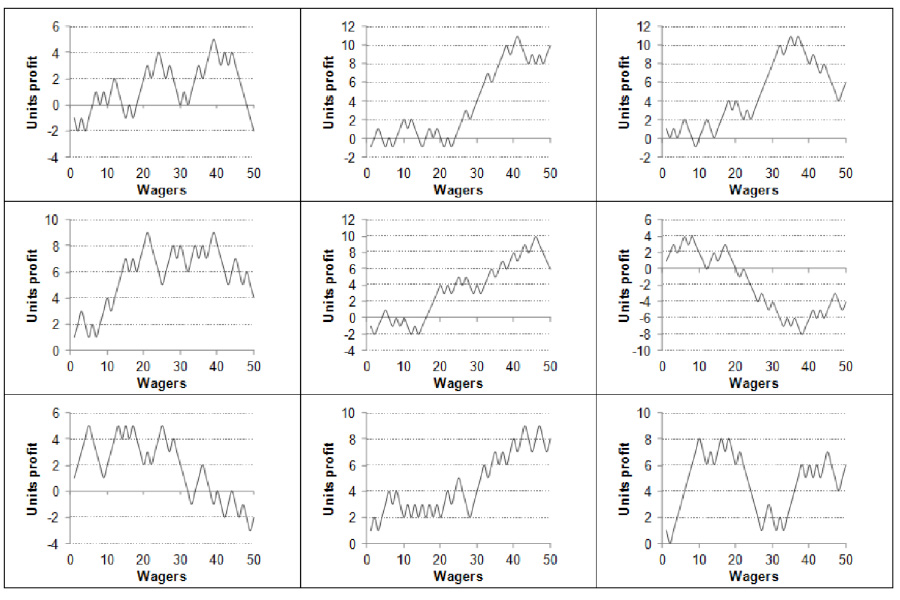
A winning sports bettor would undoubtedly find it useful to be able to estimate the probability of making a profitable monthly return or conversely making a loss. In fact, for simple scenarios as above where all odds and stake sizes are the same we can use the binomial theorem to calculate exactly the probability of finishing with a loss. In this example it’s 19.7%.
What if we change the betting odds? The first chart below shows how the probability of having a losing month after 50 wagers varies depending on what odds we are betting at.
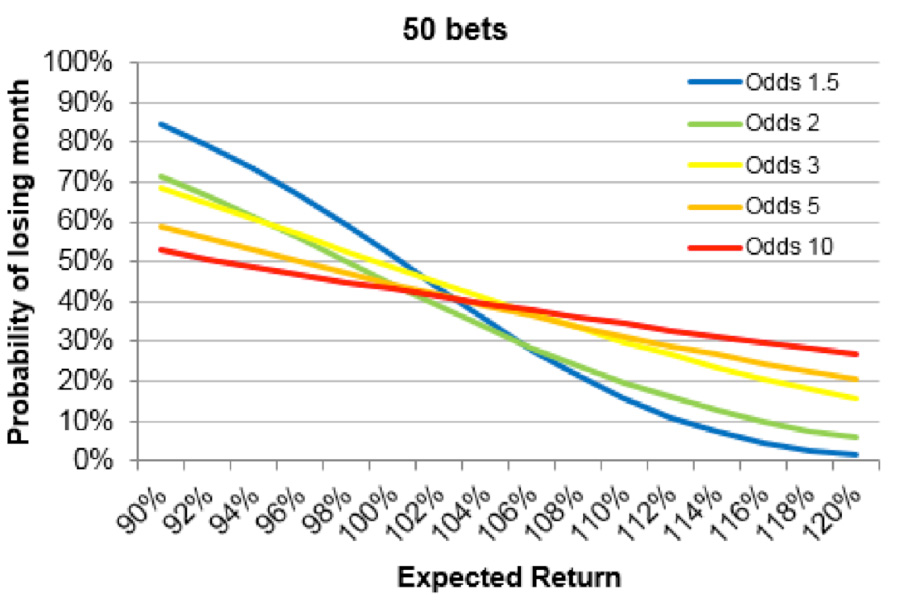
Understandably the poorer our expected return, the greater the probability that our month will be a losing one. What is also clear is the impact of the higher variance when betting at longer odds. Over a relatively small sample of wagers such as this, luck will play a much bigger role at longer prices. Even with a healthy advantage we can still expect to lose money in a significant number of months.
At odds of 10, the probability of a making a loss is about 27%, with an expected return of 120%. That’s hardly much of an improvement on betting those odds when we hold no advantage at all (43%). By contrast, our monthly expectations when betting short odds of 1.5 are much more influenced by the size of the advantage we hold and much less so by chance.
The next chart reveals how things change when we increase the monthly number of wagers to 250.
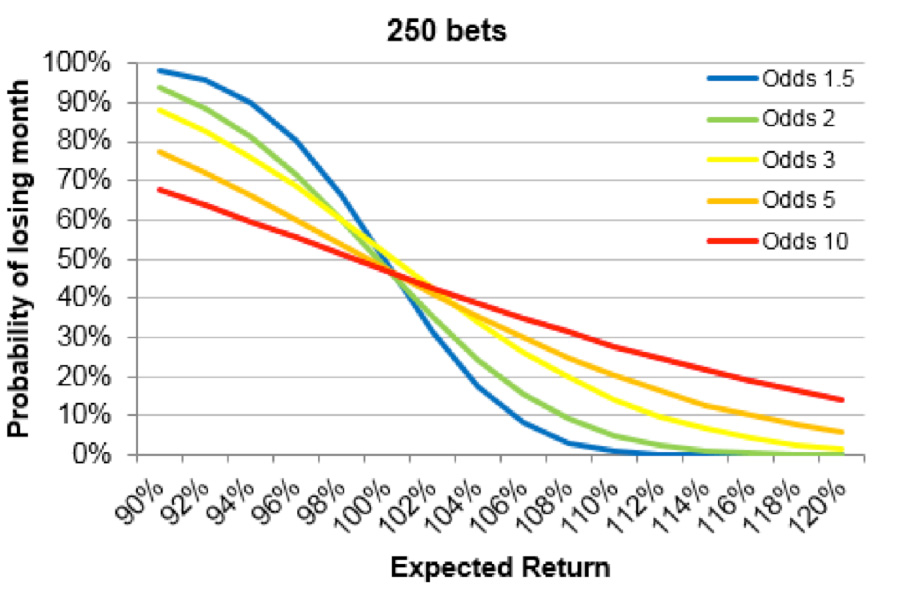
Now monthly expectations are much more clearly defined, even for longer odds. Unsurprisingly, the larger the sample of bets, the greater the likelihood we will finish the month with a profit. This is due to the law of large numbers provided we hold profitable expectation. Of course, the corollary is true: where we fail to hold an advantage over the odds, a larger number of bets will imply a greater probability of loss.
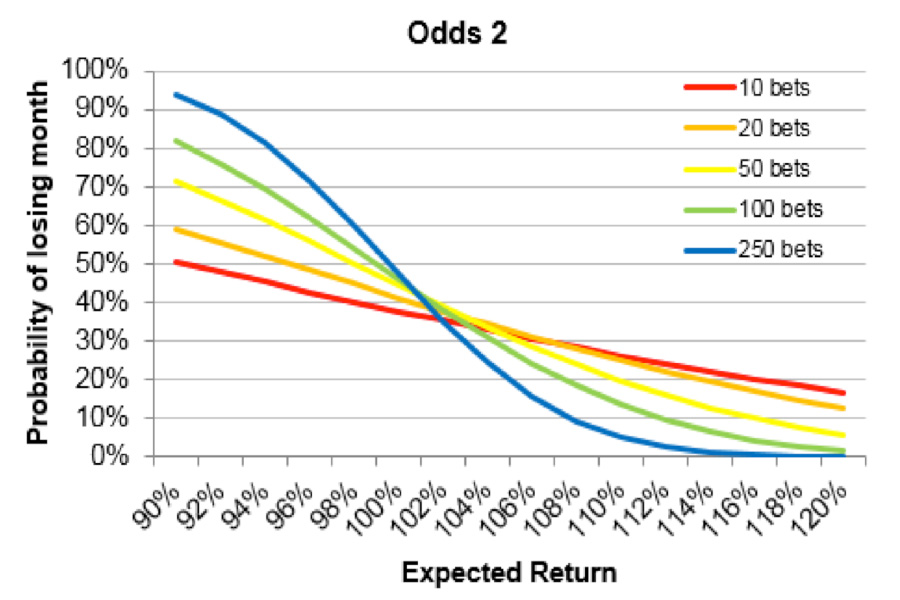
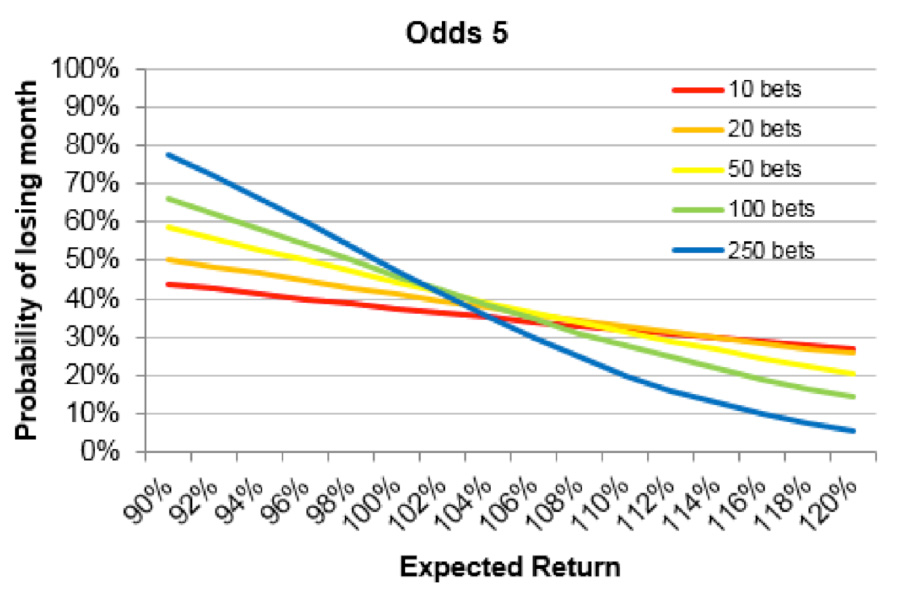
The final two charts compare monthly expectations for odds of 2.00 and 5.00 respectively for five different sample sizes: 10, 20, 50, 100 and 250 wagers. They broadly reiterate what the first two charts were telling us:
- The greater the advantage (disadvantage) we hold, the greater the probability that we will make a profit (loss).
- The more wagers we place, the greater the likelihood that we will make a profit (loss) over that period where we hold (do not hold) an advantage.
- The shorter the odds we bet, the smaller the influence of chance will be.
For anyone interested in running their own binomial scenarios, the following Excel formula may be used to calculate the probability of loss from a sample of wagers:
=BINOMDIST(ROUNDUP((n/o)-1,0), n, r/o, TRUE)
where n = number of wagers, o = odds and r = expected return on investment or expected advantage expressed either as a percentage or a decimal (e.g. 110% = 1.1).
R.J. Miller told his readership that with a 55% strike rate and 125 wagers per month, he could expect to lose money every 9th month. At odds of 1.909 (n = 125, r/o = 0.55), the binomial equation yields a probability of having a losing month of 27.9%, or over 1-in-4. Evidently, Miller got his maths wrong for this calculation.
Alternatively, perhaps he was thinking of fair even-money handicaps without the bookmaker’s margin applied. In this case the probability would be 13.1%, closer to his assumption. Inaccuracies aside, Miller was correct on the broader point he was making: an effective betting strategy is aided by “knowing what to expect.”
For more complicated histories with different betting prices and stake sizes, a Monte Carlo simulation would be required instead.
Conclusion: How often do winners get paid?
Finding an advantage in sports betting is hard; few bettors manage to achieve it over the long term beyond the influence of luck. Even proven winners will have to moderate their expectations of profitability. New bankroll highs will be far less common than most people would imagine.
Moreover, expectations of receiving a profitable income month after month should be tempered with some statistical realism. Hopefully this article has demonstrated how difficult earning a living from sports betting can be.
MORE: TOP 100 Online Bookmakers >>>
MORE: TOP 20 Bookmakers that accept U.S. players >>>
MORE: TOP 20 Bookmakers that accept Cryptocurrency >>>
Source: pinnacle.com
