
Commonly known for its application to basketball free-throws, the hot hand fallacy is by no means a modern concept in sports. However, it can be applied to multiple sports and be used as part of a betting strategy. How does the hot hand fallacy work in soccer betting? Read on to find out.
Many of my previous articles for Pinnacle, and much of the underlying reasoning in my book Squares and Sharps, Suckers and Sharks: The Science, Psychology and Philosophy of Gambling, has considered sports betting to be an almost impossible nut to crack.
Prices, I have argued, at least for the most liquid (heavily bet) markets like Premier League match odds, broadly speaking reflect the ‘true’ probabilities of their associated results. To put it another way, those betting odds are efficient, reflecting all the publicly available information there is to be had about two soccer teams. Once the bookmaker takes their cut of the action, bettors on either side will be unable to find a profitable expectation.
Of course, on a bet-by-bet basis mistakes will occur, but over a large number of matches, because news about soccer teams arrives at a market randomly, so the betting outcomes for customers will be driven by chance. With good and bad luck cancelling out over the long term, what’s usually left is profit for the bookmaker and losses for the majority of customers.
What’s wrong with the efficient market hypothesis?
In recent decades, the efficient market hypothesis has, to some extent, fallen out of favour. Many now argue that human beings do not behave in a manner that leads to such efficient pricing, on account of the expression of systematic (non-random) errors or biases that result in less than fully rational markets, betting included.
One commonly cited reason for this is our inability to properly weight large and small probabilities. Specifically, it is observed that people systematically overestimate/underestimate the probability of unlikely/likely events occurring, and by doing so wager too much/too little money on longshots/favourites. This bias, arising out of the possibility/certainty effect is unsurprisingly known as the favourite-longshot bias. This bias has been pervasive in many sports betting markets for decades.
The fallacy of hot hands
The misjudgement of probabilities is not the only way people can express a bias in a betting market. Another way people might exhibit a systematic bias is via the hot hand fallacy, sometimes also called the reverse gambler’s fallacy.
A profit could still have actually been returned from betting Pinnacle’s closing prices on the relatively ‘coldest’ teams.
The error initially arises because the extent to which randomness in a repetitive pattern or streak is present is underestimated. Instead, causal explanations for such streaks are preferred which should prolong the longevity of the streak.
The hot had fallacy was first coined by Amos Tversky and colleagues in their 1985 paper The Hot Hand in Basketball, in which they showed a person’s sense of hot streaks was attributed to a general misconception of chance. In expressing such a fallacy, the influence of regression to the mean (the tendency for a variable to be closer to the average on a subsequent measurement following a previous extreme one) will be ignored.
This principle informs us not that things must return to the average (the fallacious law of averages), just that they have a tendency to do so (the law of large numbers). Good luck has a tendency to be followed by outcomes that are proportionally less fortunate. The same is true for bad luck as well. ‘What is hot has a tendency to cool down’ is substituted by ‘what is hot will probably remain hot for longer.’
How might the hot hand fallacy influence a soccer betting market?
Arguably, when a team goes on a winning streak bettors take notice. This will take the form of more money being placed on them the next time they play, shortening their odds beyond values had the winning streak not occurred.
Of course, part of the reason a team will have a winning streak might be a tangible cause like the feel-good factor which previous wins inspire. However, this may well be overestimated if bettors are ignoring the influence of luck and committing the hot hand fallacy. Where chance dominates, sequences can be expected to regress towards the mean more quickly.
In terms of a hot team on a winning streak, this would imply that a team is more likely to start losing again than bettors actually believe, meaning their betting odds will be shorter than fair. In contrast, cold teams, ignored, under-bet and therefore overpriced, will be more likely to start winning again and therefore offer the possibility of positive expected value.
Measuring the ‘heat’ of soccer teams
To test such a hypothesis we need some way of measuring how ‘hot’ or ‘cold’ teams are. One way is to use the betting odds. To ensure that the odds we are using in this measurement are as fair as possible the bookmaker’s betting margin should first be removed. I have previously described in some detail various methods of how this can be done (in this article I have used a logarithmic function methodology).
There appears to be a reasonable case for the existence of an inefficient soccer match betting market that arises because of the fallacy of hot hands.
‘Heat’ can be measured in a risk-adjusted manner that takes into account the length of the odds by awarding a winning team a score of 1 - 1/odds, whilst awarding the losing team (or both teams in the case of a draw) a score of -1/odds.
Consecutive match scores for a team are then added together to obtain a running score. If the ‘fair’ odds used in the calculation are accurate, the market expectation over the longer term is for teams to have scores of zero. In terms of betting, that would equate to breaking even. Consequently, teams on ‘hot’ streaks will show positive scores over the short term, whilst those on ‘cold’ streaks will show negative scores.
Consider for example Liverpool’s first six games in the 2016/17 season. The table below shows Pinnacle’s closing odds, their assumed ‘fair’ odds with the margin removed, the game result, their score awarded for that game and their running score, by adding together previous consecutive match scores.
After six games, Liverpool were ‘hotter’ than the market had expected them to be. For their 7th game they played Swansea away, who were bringing to the game a relatively ‘colder’ running score from their first six games of -0.468.
Subtracting Swansea’s rating from Liverpool’s, we achieve a match rating of +1.442, providing a measure of how much ‘hotter’ Liverpool were relative to Swansea. Conversely, we could describe this match by a rating of -1.442, an equal and opposite measure of Swansea’s ‘heat’ relative to Liverpool. In this way, every match can be described by a pair of numerically opposite ratings.
If our hypothesis about the hot hand fallacy is correct, backing relatively ‘colder’ teams (negative ratings) should prove to be more profitable (or at least less unprofitable) than backing relatively ‘hotter’ teams (positive ratings). Hence, in this example we would consider backing Swansea, who were 1.442 points ‘colder’ in relative terms compared to Liverpool. Had we done so, we’d have lost our bet; Liverpool won 2-1. But a sample of one tells us nothing statistically. Let’s find out if a large set of data can validate our hypothesis.
Testing the hot hand hypothesis
To test our hot hand hypothesis, I’ve retrospectively analysed the past five completed seasons of soccer match betting odds data (2012/13 to 2016/17) for nine major European divisions (arguably the most liquid of football betting markets): English Premier League, Championship, League 1 and League 2, Scottish Premiership, German Bundesliga, Spanish La Liga, Italian Serie A and French Ligue 1, a total of 18,550 matches and 37,100 ratings.
In terms of a hot team on a winning streak, this would imply that a team is more likely to start losing again than bettors actually believe, meaning their betting odds will be shorter than fair.
Refining my methodology a little further I have considered only the most recent six games played by each team to calculate a team’s cumulative running score and relative rating supremacy against their opposition. This choice was purely arbitrary.
I could have chosen more or fewer, but the most recent six games are typically used in other match rating systems that consider recent form as a factor worthy of analysis. Consequently, for each season there are no match ratings for the first six games, leaving a total of 15,820 matches and 31,640 ratings.
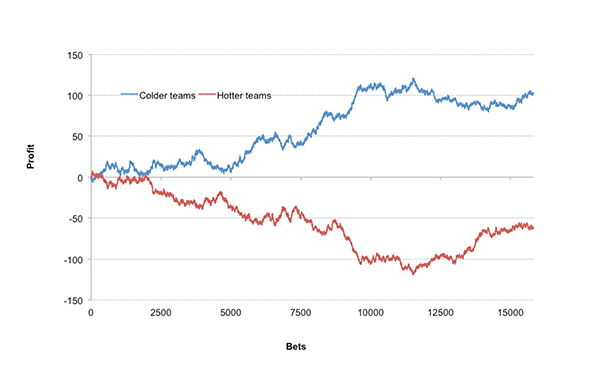
Betting on all 31,640 home and away teams at my calculated ‘fair’ odds with a risk-adjusted stake (1/odds) returned 100.35% of total turnover, a shade over expected break even. Divide these teams into exclusively negative (‘colder’) and positive (‘hotter’) ratings, however, and the returns are 101.84% and 98.99% respectively.
This may not seem like much of a difference but it is weakly statistically significant (p-value = 0.02, 2-sample, 1-tail t-test).The five-season time series of betting on relatively ‘colder’ versus ‘hotter’ teams respectively, as the chart below illustrates, is perhaps more revealing.
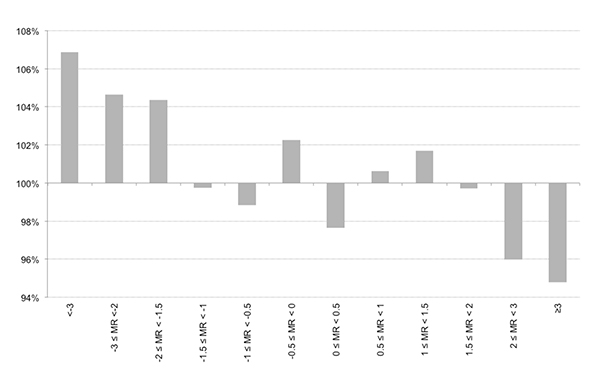
The 31,640 match ratings range between ±5.89. I have grouped them according to their ‘heat’ strength into 12 categories containing broadly speaking similar numbers. These are shown in the histogram below. There is a reasonably strong relationship between rating ‘heat’ and returns. The ‘colder’ the team relative to their opposition the superior the returns from fair betting prices.
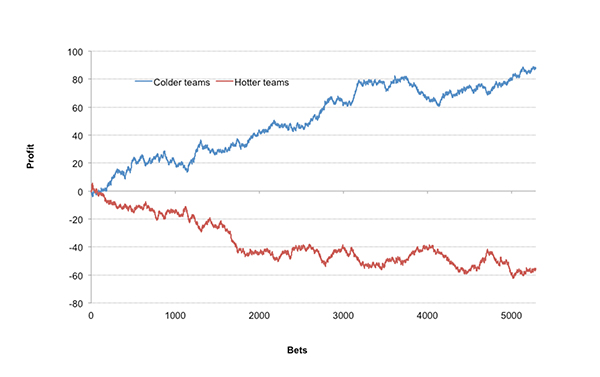
I’ve also redrawn the betting time series including only ratings ±1.50 (10,574 or 33% of the total sample). Returns for these ‘coldest’ and ‘hottest’ ratings are 104.83% and 97.36% respectively. The difference is more strongly statistically significant (p-value = -0.001)
Naturally, bookmakers aren’t in the habit of letting their customers bet at fair prices, and whilst odds comparisons can be used to find prices that are close, and sometimes actually superior to them, most bookmakers also have a habit of restricting customers for consistently exploiting them. Despite this, a profit could still have actually been returned from betting Pinnacle’s closing prices on the relatively ‘coldest’ teams, as the table below illustrates. And of course Pinnacle won’t restrict you for doing so.
Thinking beyond the hot hand fallacy
Whilst correlation never implies causation (we are very good at believing random patterns contain meaning, especially when looking for ways to make money), there appears to be a reasonable case for the existence of an inefficient soccer match betting market that arises because of the fallacy of hot hands.
Bettors, it seems, over bet teams that have had recent winning streaks. As a consequence, relatively ‘colder’ teams may offer value for those willing to go against the crowd. Naturally, this interpretation should not be viewed as a guaranteed way to make a profit, but rather an example of how understanding betting psychology and the systematic biases that arise from it might be used to identify an advantage.
MORE: TOP 100 Online Bookmakers >>>
MORE: TOP 20 Bookmakers that accept U.S. players >>>
MORE: TOP 20 Bookmakers that accept Cryptocurrency >>>
Source: pinnacle.com